

Ask five suppliers for the LiFePO4 battery lifespan behind a 500 kWh cabinet and you get five numbers that look comparable and are not. One is a cell-level cycle count measured at 25 °C. One is the same count at a shallower depth of discharge. One is a warranty term. One is the sales engineer's recollection of a warranty term. The fifth is a genuine projection for a specific duty cycle, and it is the only one that describes anything you can be held to.
The datasheet number is a statement about a test bench. The number your project lives or dies by is a statement about your duty cycle, your average state of charge, your cell temperature history, and the retention threshold written into your contract. Getting from the first to the second is arithmetic, not judgement — which is why it is worth doing properly and writing down.
For a daily-cycled solar asset both clocks land in the same order of magnitude: 8,000 cycles at 330 equivalent full cycles a year is a 24-year cycle clock, and the calendar term at 25 °C is about the same. At 40 °C the calendar term falls to single digits. So solar battery lifespan is not one number with a tolerance band — it is the shorter of two clocks, decided by duty cycle, average state of charge and cell temperature history.
This page covers the second half of that journey: converting a rating into a project figure, sizing against the last year of the warranty, the clauses worth demanding, and how to prove capacity at commissioning. The definitions and mechanisms behind cycle life and capacity fade are already covered in the knowledge base entry on cycle life and the entry on capacity degradation; this page assumes them.
A note on scope: the same arithmetic applies to a 12 V pack and to a 5 MWh container, though the consequences scale with the asset. Everything below assumes a stationary solar-plus-storage duty, because that is the case where the gap between datasheet and project is widest.
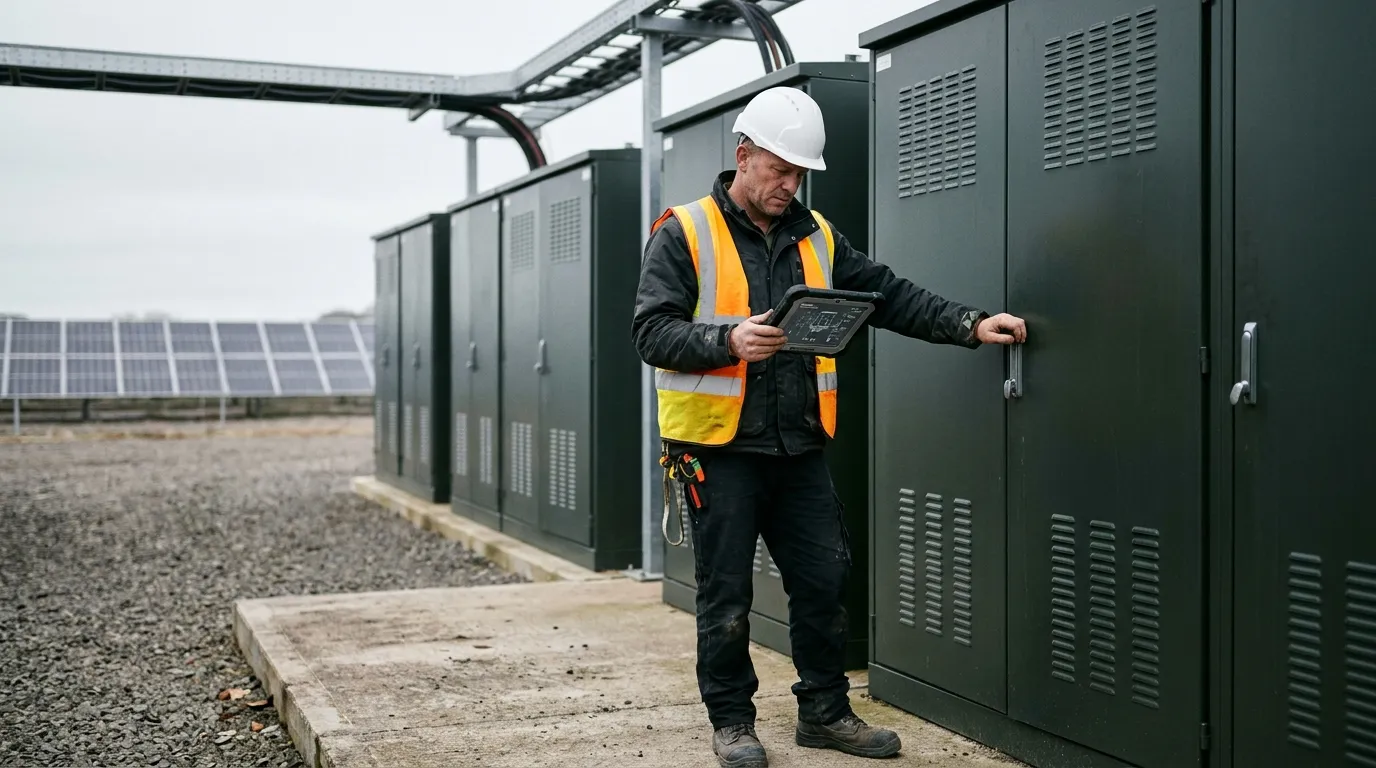
The datasheet number is a claim about conditions
A cycle-life rating is only meaningful as a tuple: cycles, depth of discharge, temperature, charge and discharge rate, and the capacity-retention threshold that ends the test. The project question is not what the number is, but which members of that tuple your own procurement clause pins down.
What buyers usually get is the tuple minus two members. The retention threshold is often there (80% is the industry convention, though 70% appears when a supplier wants a larger headline). DoD, temperature and C-rate frequently are not. When they are missing, the honest reading is not "this product lasts 8,000 cycles" but "this product has not told me what its 8,000 cycles describe." One row per member — the value you require and the condition it is measured at — turns that into a clause you can hold a supplier to, and it is the only way two bids become comparable.
There is a second, subtler problem: the test is a constant-condition test. Real duty cycles are not constant. A solar charge profile is a slow ramp followed by a long float; a peak-shaving discharge is a step load at a fixed rate; an arbitrage day is two deep swings. Each of those accumulates damage differently, and none of them is the bench. That does not make the rating useless — it makes it an upper bound on a well-behaved site and an optimistic bound on a badly behaved one.
Turning a lifepo4 battery life rating into a project lifespan
The conversion has three inputs you can actually obtain, and one you cannot.
The three: rated cycles, the retention threshold those cycles are counted to, and the equivalent full cycles the site will run per year. The one you cannot obtain is the damage each of those cycles does, which is why the answer comes with a range rather than a figure.
Equivalent full cycles per year is the piece most proposals skip. It is not the number of operating days. A system that discharges 60% of usable energy on 300 days a year accumulates 0.6 × 300 = 180 equivalent full cycles, not 300. A two-cycle-per-day commercial profile accumulates roughly 700. Divide the rating by that number and you get the cycle clock:
cycle clock (years) ≈ rated cycles ÷ equivalent full cycles per year
This is the step that turns LiFePO4 battery life from a datasheet claim into a site figure.
For an asset running 330 equivalent full cycles a year, an 8,000-cycle rating at 80% retention lands at about 24 years — the figure the opening section quoted, now with its arithmetic visible. That figure is where most content stops, and it is close to meaningless on its own, because the second clock is running at the same time.
Calendar aging proceeds whether or not the asset cycles. The IEA PVPS task on off-grid battery systems states the point plainly: aging begins from the moment the cell is manufactured, before it is ever installed. A widely cited LFP calendar-aging study that ran cells for 27 to 43 months and extrapolated to 80% capacity found the storage condition dominates the outcome — roughly 23.8 years at 50% state of charge and 25 °C, 45.1 years at 10% state of charge and 25 °C, and 8.7 years at the same 50% state of charge but 40 °C (Energies 14(6):1732). Cells held at 55 °C and 50% state of charge crossed the 20% fade line in 27 months of real time.
Two clocks. The temptation is to take the smaller one. The correct move is to treat them as additive, because they are separate damage mechanisms that consume the same capacity budget. Work in delivered capacity rather than years and the arithmetic becomes honest:
capacity loss total ≈ cycle loss (from throughput) + calendar loss (from time, temperature, average state of charge)
An independent modelling study on standalone PV systems is explicit that models counting only cycle aging overestimate life badly, and that both terms are required (Applied Sciences 11(3):1099). The same study lands on roughly 20 years for a cool site and 13.7 years once the average temperature is high — a 30% swing from temperature alone. For a project, that is the difference between quoting a 24-year cycle clock and quoting a number you can defend. The knowledge base goes through the mechanisms; the practical consequence is that you should never quote a cycle-derived year count to a client without subtracting a calendar term.
Size for the last year of the warranty, not for day one
This is where most solar-plus-storage designs lose their margin, and it is a pure arithmetic failure rather than a hardware one.
A system sized so that nominal capacity equals the required delivered energy is promising a number it cannot deliver in year three, let alone year ten. The requirement has to be met at the end of the warranty period, against the retention floor in the contract, through the usable state-of-charge window, and with round-trip losses applied if the requirement is stated at the AC terminals.
required nameplate (DC) ≥ required AC energy ÷ round-trip efficiency ÷ (retention floor × usable SoC window)
Take a worked example with stated assumptions. Requirement: 1,000 kWh at the AC terminals, ten hours of discharge, on the last day of a ten-year warranty. Assume a retention floor of 80%, a usable window of 90% depth of discharge, and a system round-trip efficiency of 85%. The nameplate demand is 1,000 ÷ 0.85 ÷ (0.80 × 0.90) ≈ 1,634 kWh.
Against a 1,000 kWh nameplate, the same requirement is short from year one and 39% short by year ten:
Point in life | Assumed retention | Delivered at AC (1,000 kWh nameplate) | Shortfall vs requirement |
|---|---|---|---|
Year 1 | 100% | ~765 kWh | −235 kWh |
Year 5 | ~90% | ~688 kWh | −312 kWh |
Year 10 | 80% | ~612 kWh | −388 kWh |
The assumptions are illustrative, not a forecast of any specific product: linear fade to the contractual floor, fixed efficiency, fixed usable window. Change them and the output changes. What does not change is the direction — a system sized at requirement ÷ efficiency delivers roughly three-quarters of the requirement on day one, because the retention floor and the depth-of-discharge window were never in the sum.
Two design notes before anyone adds this to a spreadsheet. First, retention floors are contractual instruments, not physics: a supplier warranting 70% at year ten is offering a different product from one warranting 80%, and the nameplate demand differs by about 14% between them. Second, the usable window is not free either — pushing depth of discharge higher trades nameplate for cycle life, so the honest optimisation is joint, not sequential.
Calendar aging: the lifepo4 battery lifespan clock you cannot cycle away
Low-cycling assets are where lifespan forecasts go wrong most often, and the reason is structural. A backup asset, a capacity-market unit, or an oversized self-consumption system may run 20 to 60 equivalent full cycles a year. The cycle clock for such an asset reads in the hundreds of years. The calendar clock reads in the tens. Lifespan is entirely a calendar problem, and no amount of careful cycling changes it.
Calendar damage is driven by three things: time, cell temperature, and the state of charge the cell sits at. Time is not negotiable. The other two are design and operating decisions, and both are larger levers than most specifications admit.
Temperature is the well-known one, and the numbers are steep — in the LFP calendar study above, moving the storage temperature from 25 °C to 40 °C cut the extrapolated time to 80% capacity from about 23.8 years to about 8.7 years at the same state of charge. Temperature, in other words, is not a comfort setting; it is a multiplier on the whole life forecast. Any site where the cells sit above 30 °C for much of the year should be sized with a shorter calendar term and monitored accordingly. The mechanical side of that — what the specification's temperature figures actually describe, and where derating starts — is covered in battery storage temperature range.
Average state of charge is the underrated one. A controlled study cycling LFP/graphite cells across five different state-of-charge windows found the average state of charge was the most influential variable on fade rate, ahead of temperature: shifting the operating window changed fade rates by 250% to 400%, while temperature accounted for 15% to 50% and electrolyte salt choice 5% to 30% (Journal of The Electrochemical Society). A second modelling study found that simply capping maximum state of charge at 70% instead of 95% extended predicted life from 7.6 to 12.5 years, at the cost of serving 89.6% of load instead of 88.8% (Electronics 10(21):2582).
That last trade is the most valuable one available to a designer, because it costs almost nothing. Dropping the ceiling on state of charge gives up a fraction of a percent of energy service and buys years of asset life. It is also the change most often blocked by an EMS configured to "keep the battery full for backup", which is exactly backwards for calendar life.
What a defensible lifepo4 battery warranty contains
A warranty that says "10 years" is not a lifespan statement. It is a legal instrument, and it is only as good as its measurement clause. Two clauses decide whether it is worth enforcing.
A retention schedule at named intervals, with the measurement conditions attached. Year one, year five, year ten — each figure tied to the discharge rate, temperature band and capacity determination it will be measured under. A single floor at the end of the term lets a battery fall to 84% in year two and stay "in warranty" for eight more years: a defect in the schedule, not in the cells.
A claim procedure that names a test you can run. Naming the method is what makes the rest of the document enforceable, and the recognised ones are specific: IEC 61427-2 gives the test methods for secondary batteries in on-grid renewable-energy storage (endurance, properties, electrical performance), and IEC 62933-2-1 the system-level unit parameters and their testing. A safety certificate is a different document class — UL 1973 states in its own scope that it does not evaluate performance, "capacity measurements under various discharge conditions" being outside it, and IEC 62619 specifies requirements and tests for safe operation — so a warranty citing only those has not told you how capacity will be measured. If the operating envelope excludes the site's real conditions, the rest of it is decorative.
One clause is worth converting rather than reading. A throughput cap in MWh divided by nameplate gives the equivalent full cycles the supplier actually expects you to run — compare that with your own number before signing.
The knowledge base entry on battery storage warranty covers how these clauses read in practice. The project-level addition is simple: the retention schedule, the throughput cap and the test method should all be things you can measure with equipment you already have on site. If proving a claim requires a laboratory the site does not have, the warranty has a defect.
Commissioning: build the SOH baseline you will argue from
The single most useful thing an EPC can do for a battery asset's lifespan is establish, on day one, a capacity number that both parties accept. Without it, every later conversation about degradation starts from the supplier's estimate of what the battery was supposed to do.
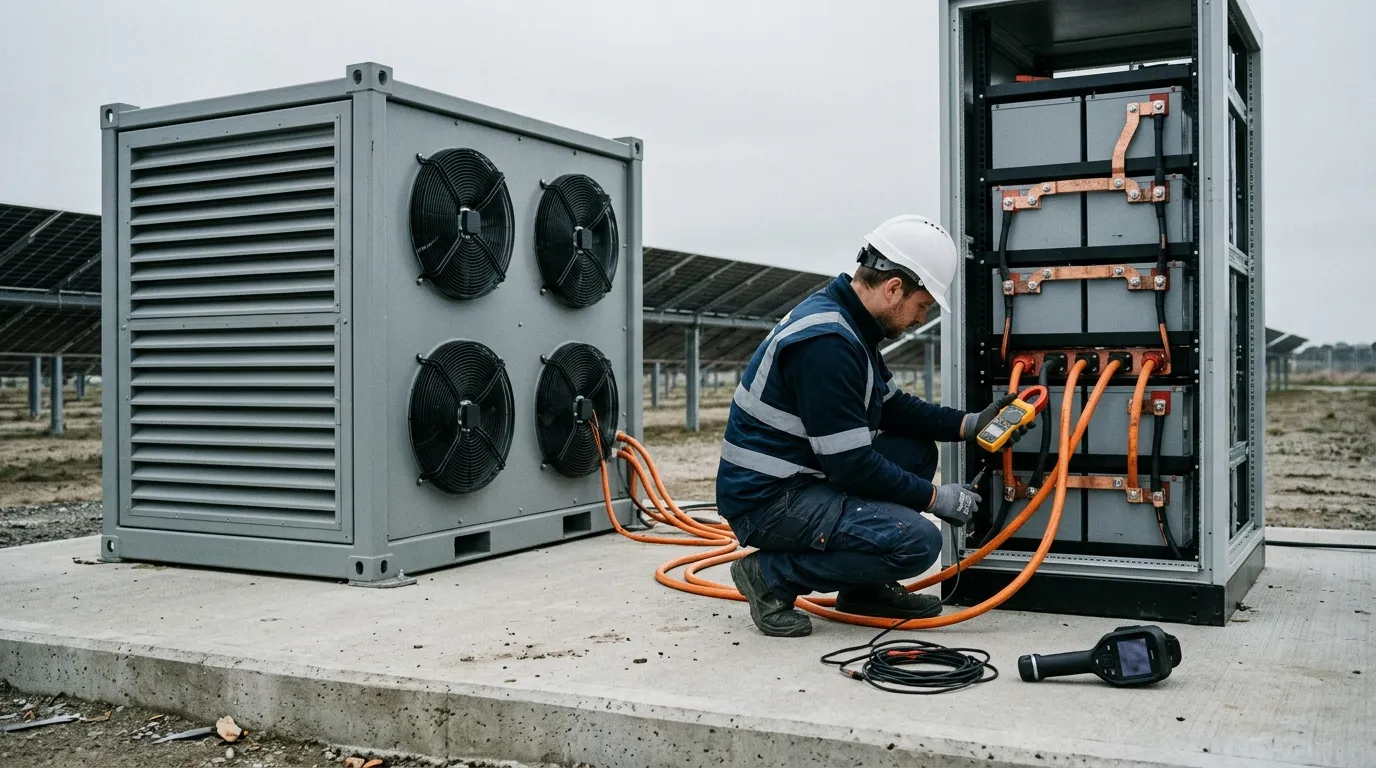
The reference capacity test itself — a full charge, then a constant-current discharge to the lower cut-off at a defined rate and controlled temperature — is the method described in the capacity degradation entry above. What a commissioning baseline adds is the discipline around it:
- Charge at the rate the warranty names, and hold at the absorption voltage until current falls to the BMS's taper flag. Note that threshold in amps: a test that stops on a different one is not the same test.
- Rest until the cell voltage has stopped moving — open-circuit voltage drift below roughly 5 mV per hour per cell is a workable criterion for the checklist. This is the step most often skipped: a cell still relaxing holds surface charge above its settled value, so the discharge looks better than the asset is. Log the elapsed time next to the criterion, so the next test rests to the same physical state rather than to the same clock.
- Discharge at the declared rate to the lower cut-off, integrating DC energy rather than multiplying nameplate voltage by amp-hours — and run the sequence to the reference method named in the warranty (IEC 61427-2 for on-grid renewable-energy storage, or IEC 62933-2-1 at system level), so the commissioning number and the year-five claim are measured the same way.
- Hold the test inside the warranty's temperature band, recording cell and coolant temperatures throughout — inlet, outlet and cell maximum, not one average. A result quoted outside the band is contestable, and it will be contested at the moment the number matters.
- Log string-level and cluster-level energy, not just the system total. The total tells you whether there is a problem; the string spread tells you where.
The output is a baseline state of health, a per-string reference, and a DC internal resistance figure from the same test. Those three numbers are what every later claim is measured against. They also make later diagnosis cheap, because a string that was 2% below its siblings at commissioning and is 6% below in year four is telling a different story from one that was at parity and then drifted.
The instrumentation for this lives in the BMS, and the question worth asking before sign-off is whether the BMS logs what you need at the resolution you need it. BMS architecture and what it measures is the reference; the commissioning checklist item is string-level energy and cell temperature history with a retention period at least as long as the warranty.
Diagnosis: fade, imbalance, or a BMS that is guessing
When a site reports lost capacity, the reflex is to call it degradation. In practice three different faults present the same way, and only one of them is irreversible — most lifepo4 degradation reported from the field turns out to be one of the other two.
Signature | What you see at string and cluster level | The test that separates it |
|---|---|---|
Genuine fade | All strings decline roughly in proportion, DC internal resistance rises steadily, and the fade rate is smooth | Repeat the capacity test at matched temperature: string spread unchanged and fade rate matching the calendar-plus-cycle expectation for the site's history means physics — the decision becomes what to do about it, not what to fix |
Imbalance | One or two strings or clusters sit consistently below their siblings, the spread widens under load, and system capacity is limited by the weakest unit | Full top-balance, then repeat the test: material recovery means imbalance, and the root cause is usually a weak cell, a failed sense connection, or an equalisation routine that never actually completes |
Estimation drift | Reported state of health falls while delivered energy does not, and no single string stands out | Run the capacity test and compare measured energy with the BMS's own reported state of health at the same moment: a persistent gap between measured and reported is a calibration issue, not a battery issue |
One signal deserves separate attention: a change in the rate of fade. Degradation in LFP is broadly linear until it is not; when the curve bends downward, the dominant aging mechanism has changed and the remaining life is shorter than a linear projection suggests. A bend in the curve is the trigger to plan augmentation rather than to keep extrapolating.
Augment, oversize, or accept
Once a system is measurably short of its requirement, there are three honest responses and one dishonest one. The dishonest one is to keep operating against a requirement the asset no longer meets.
Augment adds capacity in year five or year eight, when the shortfall becomes real. It defers capital, keeps the initial system smaller and cheaper, and uses whatever cell pricing exists at the time. It costs floor space and interconnection capacity reserved for later, a second commissioning exercise, and whatever the augmentation itself costs per kWh at that future date.
Oversize buys the whole margin at day one. It pays capital early, occupies the space immediately, and — this is the part usually missed — runs the battery at a shallower average depth of discharge for its whole life, which is itself a life-extending operating condition. It also loads the inverter and interconnection with headroom that earns nothing until year eight.
Accept is legitimate when the requirement was a design assumption rather than a contractual obligation. A system that delivers 92% of a modelled peak-shaving target in year nine may still be the correct asset; the failure mode is discovering that nobody wrote down which requirement was contractual.
The comparison belongs in levelised cost of storage, not in capital cost, because all three options deliver different energy over different periods. LCOS for utility-scale storage sets out the arithmetic. The one input specific to this decision is the fade curve you expect after the knee: if the curve stays linear, augmentation can be planned late; if it bends, the case for reserving space early is stronger than the case for reserving capital.
What these numbers look like on a current product line
The three gates above are easier to read against a concrete specification. In the current Hua Power commercial and industrial cabinet range, cycle life is rated at 8,000 cycles or more to 80% state of health at 0.5C, with system round-trip efficiency of 85% or better and an operating window of −20 °C to 50 °C that derates above 45 °C. The container models in the same line — the HC-UPSB5010L, for instance — add a 90% depth-of-discharge rating and round-trip efficiency of 87% or better, which is the difference those two numbers make to the sizing inequality in the third section.
Read those figures the way this page has argued: 8,000 cycles at 80% is a conditional claim, the 0.5C is one of its conditions, the 45 °C derating point is where the temperature term in the calendar clock starts to bite, and the round-trip efficiency is a divisor in the nameplate calculation rather than a footnote. The residential line is rated more conservatively — 6,000 cycles at 80% for most models, 8,000 for the largest wall-mounted unit — which is the correct shape of answer for an asset that is more likely to be calendar-limited than cycle-limited.
If you want the degradation margin in your own project calculated against a specific duty profile, the engineering team will run it — that is a sizing conversation, not a sales one.
What to read next
If the mechanism side is still fuzzy, start with what a LiFePO4 battery is. If you are still deciding between chemistries, LiFePO4 versus other lithium-ion chemistries covers where the cycle-life gap actually comes from. And when the sizing question becomes a procurement question, the battery energy storage basics hub collects the rest of this cluster.