

A LiFePO4 voltage chart is a lookup table, and like any lookup table it is only true under the conditions it was built for. The three numbers people quote most — 3.40 V rested and full, 3.20 V at a fifth of a charge, 2.50 V at the protection floor — are not three readings of one cell in one state. The first two describe a cell that has been sitting still, with no charger attached and no load drawing current. Read that same cell while it is charging and its terminals sit at 3.65 V. Read it with a 100 A load on it and it sags below the row you are looking at. One battery, three answers, all correct.
That distinction is the whole page: the chart, the conditions it holds under, and the arithmetic that carries one curve from a 12 V pack to a 1,331.2 V string.
What a LiFePO4 voltage chart actually measures
State of charge is the percentage of a battery's usable capacity still inside it. Voltage is the electrical pressure at its terminals. For lithium iron phosphate — a chemistry whose charge and discharge behavior is unusually flat through the middle of its range — the two are related, but not in a way that survives careless reading.
Three measurement states matter, and they produce three unrelated numbers:
- Charging. The charger holds the terminal voltage above the cell's own potential, so you read the charger's setting as much as the battery's state.
- Rested. No current in or out, voltage relaxed to its equilibrium value. This is what the chart documents.
- Loaded. Current flowing, and the terminal voltage drops by the current multiplied by the internal resistance. The bigger the load, the further below the chart you are.
A LiFePO4 voltage chart, then, is a table of rested open-circuit voltage against approximate state of charge. Nothing else. The moment current starts moving, or the pack has not finished relaxing, or the cell is cold, you are reading a different instrument.
The habit of reading voltage as a fuel gauge comes from lead-acid, where the discharge curve is steep enough to make the practice reasonable. LFP flattened that curve and the habit survived the chemistry, which is why a page like this one exists at all.
How long counts as rested depends on the cell. Published resting tables assume hours of idle time; practical guides settle for fifteen to thirty minutes. Both are points on the same relaxation curve, and the difference is measured in millivolts — which, further down this page, turns out to be expensive.
The LiFePO4 voltage chart, cell to pack
The chart below prints one curve and three multiplications of it. Every pack column is the single-cell column multiplied by the number of cells in series — four for a 12.8 V pack, eight for 25.6 V (the 24 V class), sixteen for 51.2 V — printed to two decimals wherever the multiplication produces them. Nothing else changes, which is why almost every 12 V LiFePO4 voltage chart you will find online is this third column on its own, and why a LiFePO4 battery voltage chart printed for one pack class reads as a different table for the next one.
State of charge | 1 cell (1S) | 12.8 V (4S) | 25.6 V (8S) | 51.2 V (16S) |
|---|---|---|---|---|
100% — charging endpoint | 3.65 V | 14.6 V | 29.2 V | 58.4 V |
100% — rested | 3.40 V | 13.6 V | 27.2 V | 54.4 V |
90% | 3.35 V | 13.4 V | 26.8 V | 53.6 V |
80% | 3.32 V | 13.28 V | 26.56 V | 53.12 V |
70% | 3.30 V | 13.2 V | 26.4 V | 52.8 V |
60% | 3.27 V | 13.08 V | 26.16 V | 52.32 V |
50% | 3.26 V | 13.04 V | 26.08 V | 52.16 V |
40% | 3.25 V | 13.0 V | 26.0 V | 52.0 V |
30% | 3.22 V | 12.88 V | 25.76 V | 51.52 V |
20% | 3.20 V | 12.8 V | 25.6 V | 51.2 V |
10% | 3.00 V | 12.0 V | 24.0 V | 48.0 V |
0% — technical cut-off | 2.50 V | 10.0 V | 20.0 V | 40.0 V |
Two rows carry a warning label. The charging-endpoint row is not a resting measurement and should never be compared to the rest of the table. The cut-off row is where the cell is damaged if you keep going, not where a working system stops — as the system section below shows, real hardware turns off a good deal earlier. The bottom of the table is asymmetric for the same reason: from 20% to 10% the cell loses 200 millivolts in ten points, because below 20% the plateau has already ended and the curve is falling away.
There is also a naming trap in the last two columns. A "48 V" LiFePO4 battery is usually fifteen cells in series, giving 48.0 V nominal, and its numbers run about 6% below the 51.2 V column: 51.0 V rested at full, 48.9 V at half, 37.5 V at cut-off. A "51.2 V" battery is sixteen cells. Same chemistry, same chart, different series count, and the two labels are used interchangeably in sales material. The difference between nominal, operating and rated voltage is its own subject — this site's reference on nominal voltage in battery systems covers it — but for reading a chart, count the cells first.
Three voltages that get called "the voltage"
Most of the confusion around a LiFePO4 state of charge chart comes from three different numbers sharing one name.
Charging voltage is the target your charger holds, and LiFePO4 charging voltage normally tops out between 3.55 and 3.65 V per cell — 14.2 to 14.6 V on a 12.8 V pack, 56.8 to 58.4 V on a 51.2 V pack. It is a setting, not a reading.
Float voltage is a maintenance level, 3.35 to 3.40 V per cell, held after the charge ends. Several manufacturers list float as "or disabled", and storage systems often skip it: hold the pack below the charge endpoint and let it sit.
Cut-off voltage is a protection threshold, 2.5 V per cell. Below it, the cell degrades and then fails.
None of the three appears in the chart above as a measurement row, though two of them are printed there as settings: the top row is the charging endpoint, the bottom row the cut-off. The table's 100% row is a rested voltage — what a full cell reads after the charger is removed and the surface charge has decayed. Set a charger to 3.40 V because that is the 100% row and you will never finish a charge. Read 3.40 V under load and call it full, and you are reading a sag.
The middle of the chart is 150 millivolts wide
Here is the number that changes how you use this page. From 90% to 20% state of charge, the cell column moves from 3.35 V to 3.20 V. That is 150 millivolts covering seventy percentage points — 2.14 millivolts per point of state of charge.
The LiFePO4 voltage curve is not a straight line, but through that band it is close enough to one that the consequences follow immediately:
- Ten millivolts of measurement error is 4.7 points of state of charge. A handheld meter that is a couple of counts off, a probe with contact resistance, a BMS sense line with a bit of drop — any of those lands you inside that error band.
- A 1% meter error is worse than it sounds. One percent of a 51.2 V pack is 0.512 V, which is 32 mV per cell, which is fifteen points of state of charge. Scale to a 1,331.2 V string and one percent is 13.3 V — still 32 mV per cell, still fifteen points. Precision does not improve with pack size; the relative error is the same at every voltage.
- Temperature moves the curve, not just the cell. A published LFP hysteresis study from the University of Warwick found open-circuit voltage hysteresis 13 mV higher at 0 °C than at 25 °C — six points of state of charge, for temperature alone, before anything is even connected.
- Current moves it more. Terminal voltage is open-circuit voltage minus current times internal resistance. On a 51.2 V pack whose DC resistance is 20 mΩ — an illustrative figure; get the real one from the manufacturer — a 50 A discharge drops the terminals by 1.0 V, or 62 mV per cell, or roughly twenty-nine points of the chart.
This is not a reason to distrust the table. It is a reason to use it for what it is good at. Measured against a reference implementation on a 4S2P consumer lithium-ion pack at room temperature, Texas Instruments' comparison of battery gauging algorithms puts peak state-of-charge error at about 20% for plain voltage correlation, about 11% once internal-resistance correction is applied, about 6% for coulomb counting and about 1% for a model-based gauge. Voltage correlation is the method a chart implies, and 20% peak error is what the chart is worth when it is used as a fuel gauge — and on a flatter LFP plateau that figure is, if anything, conservative.
Used as a diagnostic, it is worth much more. A cell sitting at 3.20 V at rest is at 20%, give or take a few points — and if it reads 3.20 V when the BMS says the pack is at 60%, you have found a problem that no percentage display would have shown you.
A rested reading is an audit, not a measurement. It can tell you whether the counter has drifted; it cannot tell you where the battery is.
Getting a reading you can trust
Five steps turn the chart from a poster into a measurement.
- Count the cells first. Sixteen cells is 51.2 V; fifteen is 48.0 V. A reading is meaningless until you know which column you are in.
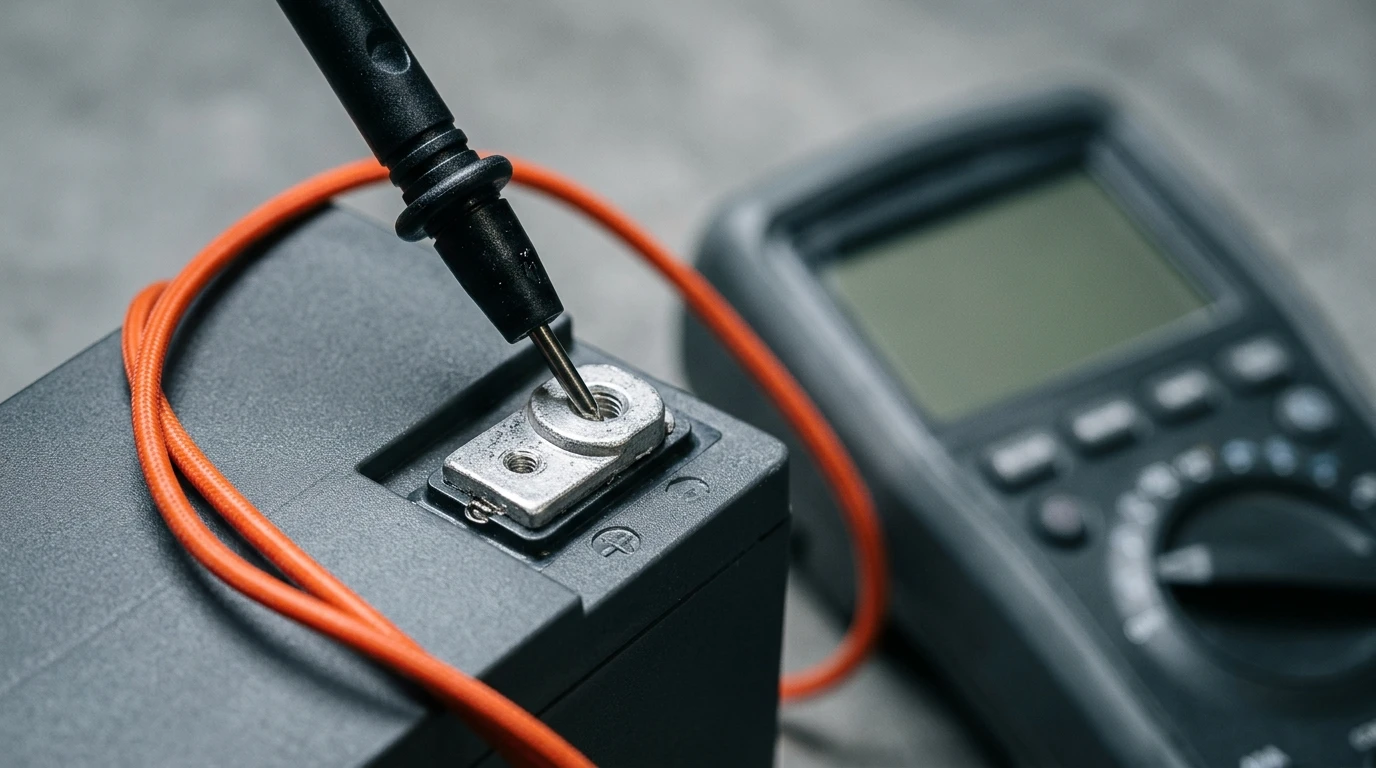
- Stop charging and stop the load, then wait. Fifteen minutes is the practical minimum; hours is what the published tables assume.
- Note the temperature. A cold pack reads low without being emptier. The chart assumes room temperature unless it says otherwise.
- Read cells, not the pack average. Sixteen cells averaging 3.26 V can be fifteen at 3.30 V and one at 2.62 V — and the pack still reads 52.1 V at rest, which looks like a healthy 40% pack. LiFePO4 cell voltage is the figure that exposes a weak cell; a pack-level number will hide one indefinitely.
- Cross-check against a coulomb counter. A shunt-based count and a rested voltage reading disagree for different reasons, and the disagreement is the information.
From a single cell to a 768 V string
Everything above is consumer hardware. The same arithmetic runs at commercial scale, and it is where the chart stops being a curiosity.
Take three published DC windows from commercial hardware and divide each by the number of cells in series:
Published DC window | Cells in series | Per cell |
|---|---|---|
672–840 V (768 V nominal, 16S1P × 15) | 240 | 2.80–3.50 V |
728–910 V (832 V nominal, 52S1P × 5) | 260 | 2.80–3.50 V |
1,164.8–1,456 V (1,331.2 V nominal, 52S1P × 8) | 416 | 2.80–3.50 V |
1,123.2–1,497.6 V (20 ft container, 1P104S × 4 × 12) | 416 | 2.70–3.60 V |
Three different nominal voltages, three different cell configurations, one result: 2.80 V to 3.50 V per cell. The 20 ft container, which runs a wider window, lands at 2.70–3.60 V. None of them uses the 2.50–3.65 V range the chart prints as its outer rows. The published system window is a design decision — 0.70 V per cell wide in the cabinets, 0.90 V in the container — taken by people who expect the pack to run for eight thousand cycles.
That gap between the chart's edges and the hardware's floor is the most useful thing on this page. A cell at 2.62 V is inside the chart's legal range and far outside the operating window of every system in the table above.

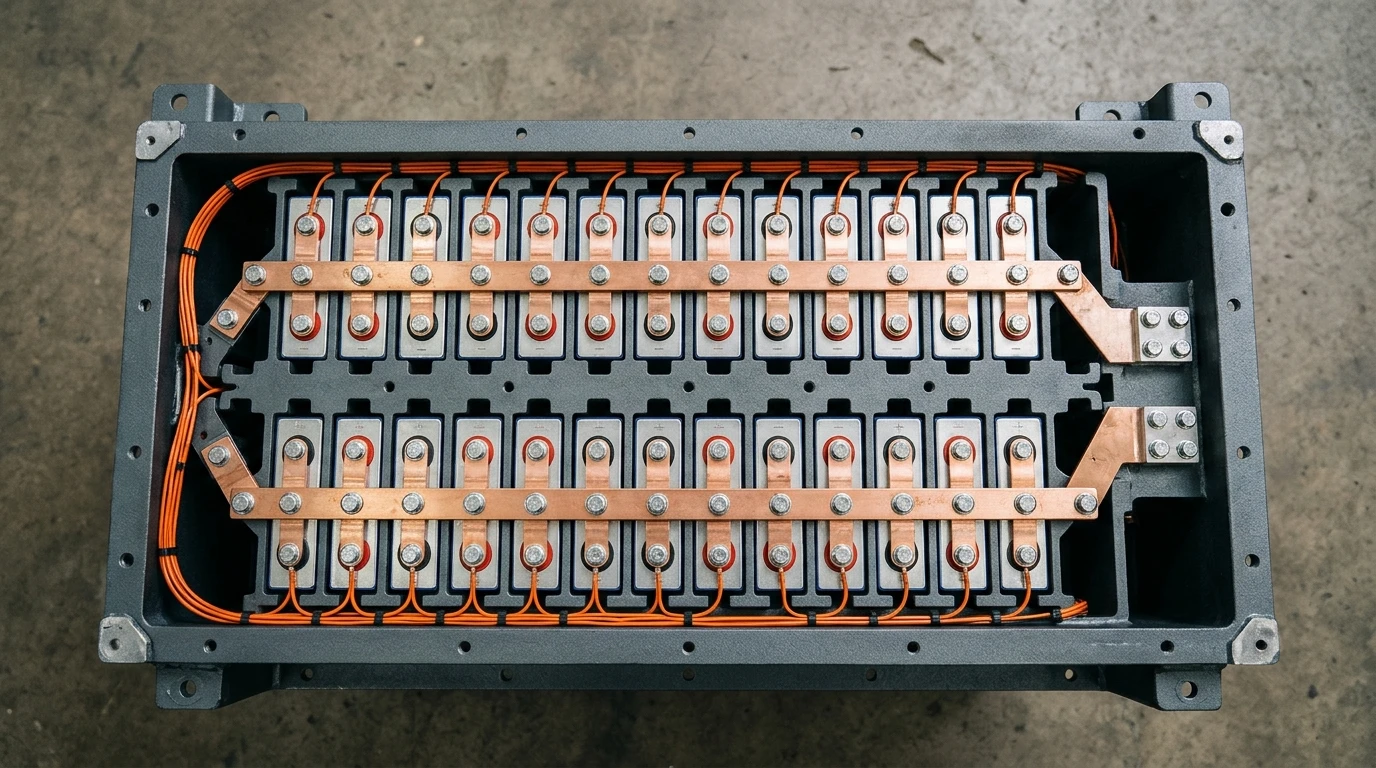
The energy check closes the loop. A 314 Ah LFP cell at 3.2 V nominal holds 1.0 kWh. Two hundred and forty of them in series is 241.152 kWh at 768 V — which is exactly the published nameplate of the HC-UPSA241 energy storage cabinet, and dividing that nameplate by its 768 V returns 314 Ah. One cell figure, three forms: 314 Ah per cell, 314 Ah at the system terminals, 241.152 kWh of stored energy. The chart you started with multiplies into all of it, and the way series strings add voltage while holding current is set out in batteries in series versus parallel.
Do it once more at container scale. The 5,015.96 kWh nameplate of the 20 ft HC-UPSB5010L works out to 3,768 Ah at 1,331.2 V — and 3,768 divided by 314 Ah is twelve. Twelve parallel clusters of 416 cells. Same cell, same chart, same multiplication.
Where the chart stops and the BMS starts
The chart documents. The battery management system enforces. Confusing the two is how systems get configured wrongly.
A BMS sets cell-level thresholds: an over-voltage limit that stops the charge, an under-voltage limit that opens the contactor, a balance-start voltage that decides when weak cells get helped, and temperature and current limits that have nothing to do with voltage at all. Those are settings, chosen by the integrator, and they define how much of the chart's range the system is allowed to use. The architecture behind that layer is covered in how a battery management system works.
The power conversion system adds a second, narrower window. Its DC input range is what the inverter will accept, and it is usually tighter than the battery's own limits because the inverter has its own cut-offs and its own efficiency curve. A system is only as wide as the narrowest of the three.
Two standards sit underneath this. IEC 62619 covers the safety of lithium cells and batteries for industrial applications, including the BMS requirements that go with them (IEC 62619:2022); ANSI/CAN/UL 1973 covers battery systems for stationary applications (UL 1973:2022). Neither one certifies a voltage-to-state-of-charge table. What they certify is that someone has defined the limits, tested to them, and built a device that enforces them.

What to ask for instead of a chart
If you are specifying rather than reading, the chart is the wrong document to request. Five items do the job:
- The cell voltage window the BMS is configured to — over-voltage, under-voltage and balance-start values, not the cell's physical limits.
- Cells in series and the full configuration string. "768 V" is not a specification; "16S1P × 15, 240 cells" is.
- The rest conditions behind any published state-of-charge curve — a curve without a rest time and a temperature is a drawing, not data.
- Which state-of-charge method the BMS runs, and its stated error — the difference between 20% and 1% peak error.
- The PCS DC window as a separate document from the BMS window. Two numbers, and the narrower one decides.
No supplier is obliged to publish a curve. Every supplier is obliged to publish the window its BMS enforces — ask for that, and the chart becomes optional.
Quick answers
What is the nominal voltage of a LiFePO4 cell?
3.2 V. A cell charges to about 3.65 V, rests at about 3.40 V when full, and reaches its technical floor at 2.50 V. Pack voltage is the cell figure multiplied by the number of cells in series — four cells for 12.8 V, eight for 25.6 V (the 24 V class), sixteen for 51.2 V.
What voltage is 100% on a LiFePO4 battery?
There are two, and the gap between them is 250 millivolts — wider than the entire 150-millivolt span that covers the middle seventy points of the chart. A cell at 100% while charging reads 3.65 V; the same cell at rest reads 3.40 V. On a 51.2 V pack that is 58.4 V versus 54.4 V. The chart's 100% row is the rested figure.
Is 14.7 V too high for a 12 V LiFePO4 battery?
14.7 V across four cells is 3.675 V per cell, above the 3.65 V ceiling that cell manufacturers publish. The normal charging band is 14.2 to 14.6 V. A charger sitting at 14.7 V will likely trip the BMS over-voltage protection, and if protection fails it will shorten the cell's life. Check the charger's profile before assuming the battery is at fault.
What is the 80/20 rule for lithium batteries?
Charge to 80%, discharge no lower than 20%. On this chart that is a band from 3.32 V to 3.20 V per cell — 120 millivolts for sixty percentage points, about two millivolts per point. That is exactly why the rule is implemented as a state-of-charge limit in the BMS rather than as a voltage threshold on a meter: a ±10 mV meter error covers a sixth of the band.
What is the low-voltage cutoff for LiFePO4?
2.50 V per cell is the technical floor — 10.0 V on a 12.8 V pack, 40.0 V on a 51.2 V pack. Commercial hardware does not run there. The system windows in the table above put the operating floor at 2.70 to 2.80 V per cell, which is where the economics of an eight-thousand-cycle warranty are decided.
Why does my 51.2 V battery read 52 V at rest?
52.0 V across sixteen cells is 3.25 V per cell, which is the 40% row. It is also within the error band of anything from 20% to 90%, because the whole plateau is 150 millivolts wide. A rested voltage in that range tells you the battery is neither empty nor full. It cannot tell you more than that, and a shunt-based monitor is the only way to get the rest.
Use the chart as a check, not a gauge
Keep the LiFePO4 voltage chart for what it can prove: this cell is healthy, that one is drifting, this pack is somewhere in the middle of its range, that string is nowhere near its floor. For anything that needs a number — runtime, revenue, warranty compliance, a report to a client — use a counter and a model, and treat the voltage reading as the audit that catches the counter when it drifts.
The rest of the groundwork this page assumes — nominal voltages, depth of discharge, C-rate, series and parallel topology — is collected in the battery energy storage basics hub.