
Capacity degradation is the irreversible, gradual loss of a battery's ability to store and deliver energy, measured as the decline in capacity it can provide at its rated voltage compared with its rated capacity when new. Every lithium-ion battery loses capacity with every cycle and every day on the shelf; the question is only how fast. In an energy storage system (ESS), that rate decides warranty terms, earnings in year five, and whether the site still meets its contracted discharge window at the end of the decade.
This article explains what capacity degradation is, the two aging paths behind it, the stress factors that accelerate it, how it is measured and predicted, and how it shapes storage-system sizing and economics.
What Is Battery Capacity Degradation?
Capacity degradation (also called capacity fade or capacity loss) is the reduction of a battery's full charge capacity — the energy it can deliver from fully charged to its discharge cutoff. It is expressed as a percentage of the rated capacity:
Capacity retention (%) = (current full charge capacity ÷ rated capacity) × 100
A battery rated 100 Ah that now measures 92 Ah has degraded 8% and retains 92% of its rated capacity. The industry-standard end-of-life threshold for stationary storage is generally taken as 80% capacity retention — the point at which the battery has lost one-fifth of its nameplate energy. Wikipedia's capacity loss entry documents the same concept and reports early lithium-ion studies showing 12.4–24.1% capacity loss after 500 cycles.
Capacity degradation is distinct from the "usable" capacity that a battery management system (BMS) enforces by limiting the operating window: the BMS restricts how much of the remaining capacity you may use, while degradation permanently shrinks the amount there is to restrict. It is also distinct from power fade — the loss of peak power — although the two travel together.
Cycle Aging: Wear from Every Charge and Discharge
Cycle aging is the capacity loss accumulated through charging and discharging. Each cycle stresses the cell electrochemically and mechanically, and the damage is cumulative. Four mechanisms dominate lithium-ion aging:
- SEI growth. The solid electrolyte interphase on the anode thickens, consuming cyclable lithium and electrolyte. It is the most common aging mechanism, and it proceeds even when the battery sits idle.
- Loss of lithium inventory (LLI). Lithium trapped in the SEI or in plated metal is no longer available for charge transport, so the cell's usable capacity shrinks.
- Loss of active material (LAM). Electrode particles crack under the mechanical stress of lithium insertion and extraction, isolating active material from the circuit.
- Lithium plating. Under cold temperatures or fast charging, lithium deposits as metal on the anode instead of intercalating — clogging pores, raising resistance, and consuming inventory.
A 2023 study in Energies modeling capacity degradation and aging mechanisms under different operation conditions found these mechanisms interact: high temperature accelerates SEI growth and active-material loss, while low temperature plus high charge rates triggers lithium plating. The dominant mechanism shifts with how the battery is used. Depth of discharge (DoD) sets the stress per cycle: the same study found 100% DoD cycling degrades capacity markedly faster than shallow 20% DoD cycling.
Calendar Aging: The Battery That Ages Even When Idle
Calendar aging is the capacity loss that proceeds while the battery is not being cycled at all. Even disconnected, the cell's internal chemistry keeps reacting — SEI continues to grow, driven by two variables the operator controls: temperature and state of charge.
The rule of thumb: the hotter the battery and the higher its state of charge, the faster it calendar-ages. A cell stored at 100% SoC and 45 °C loses capacity several times faster than one stored at 50% SoC and 25 °C. High SoC means a more aggressive electrolyte environment; high temperature accelerates every side reaction. This is why operators do not park fully charged batteries in the sun, and why shipping procedures specify storage conditions.
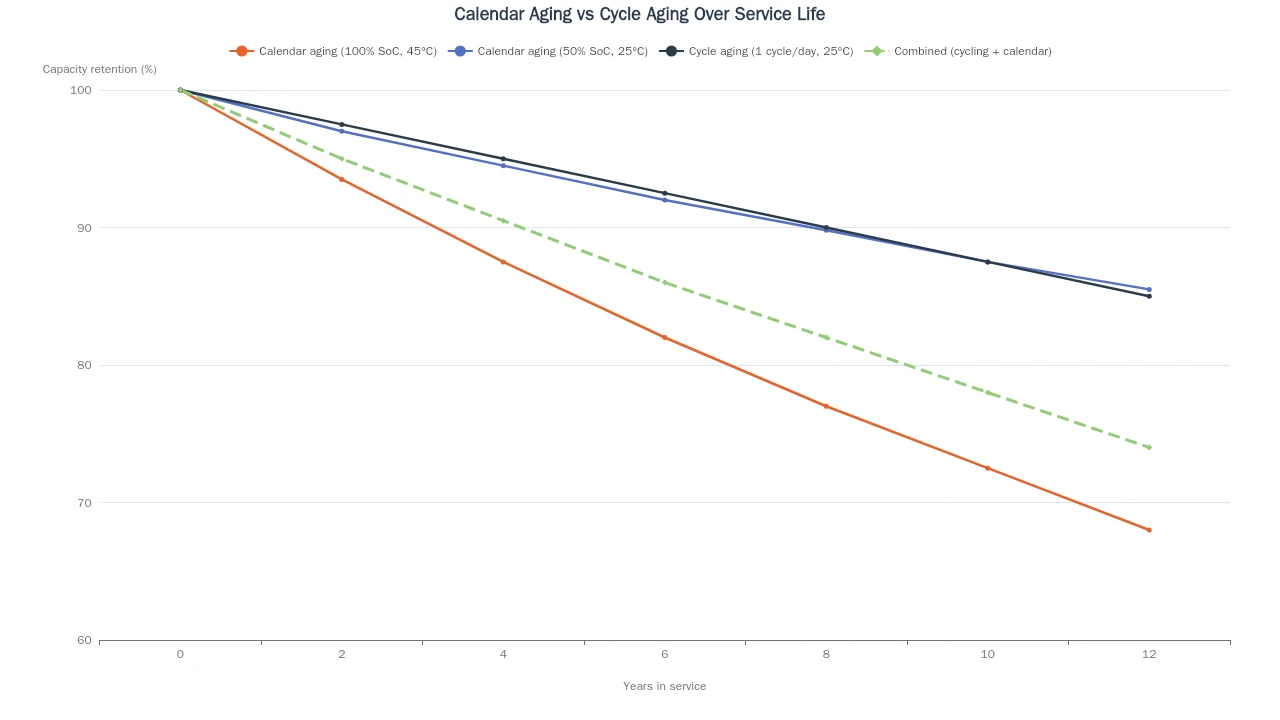
Image: illustrative capacity retention over service time — calendar aging at high SoC and temperature pulls capacity down even without cycling; cycle aging adds further loss on top.
For a grid asset cycling once a day, calendar aging is often the larger share of capacity loss in the first years — the system spends most of its life sitting at partial charge. Holding the fleet at moderate SoC (for example, capping charge at 90–95%) is a degradation control, not just a safety margin.
The Stress Factors That Accelerate Capacity Loss
Operators control most degradation through four stress factors:
Stress factor | Effect on capacity degradation | Practical control |
|---|---|---|
Temperature | Heat accelerates SEI growth and side reactions; cold + fast charge triggers lithium plating | Keep cells in a 15–35 °C band with active thermal management |
Charge voltage / high SoC | Time spent at high voltage (high SoC) accelerates calendar aging and stresses the cathode | Cap charge voltage and avoid holding at 100% SoC |
C-rate | Higher currents add mechanical stress and heat per cycle, increasing per-cycle capacity loss | Match C-rate to the application; avoid sustained high-rate cycling |
Depth of discharge | Deep cycles move more lithium and strain the electrode structure | Limit the DoD window in normal operation |
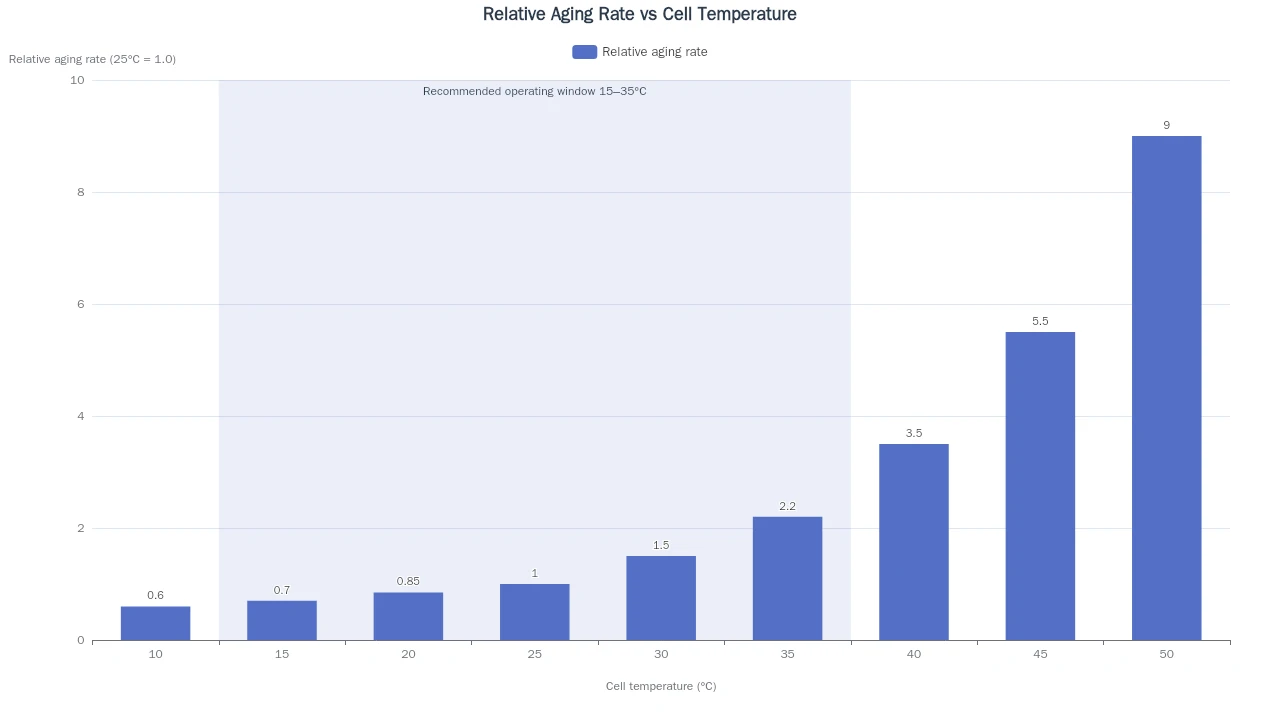
Image: illustrative relationship between cell temperature and relative aging rate — degradation accelerates steeply once the cell leaves its recommended operating window.
Temperature deserves emphasis because it compounds: heat accelerates aging directly, and high current generates heat, so a poorly cooled system ages itself faster under load. Industry references such as gridX's battery degradation explainer put typical lithium-ion degradation at 1–3% per year under standard conditions — but deep DoD, high temperature, and aggressive charging all push the rate upward. C-rate and internal resistance sit at the center: resistance converts current into heat, and heat converts into capacity loss.
How Capacity Degradation Is Measured
Capacity degradation is quantified against the rating. The reference method is a full capacity test: charge fully, discharge at a defined constant current (typically 0.5C or 1C) to the cut-off voltage at controlled temperature, and integrate the ampere-hours delivered. Comparing with the rated capacity gives the capacity fade percentage:
Capacity fade (%) = 100 − capacity retention (%)
Because the test takes hours and requires the battery offline, it runs periodically — at commissioning, at warranty milestones, and at end-of-life assessment. Between tests, the industry tracks state of health (SoH), the ratio of current full charge capacity to rated capacity, estimated online from voltage, current, and temperature signals.
A powerful shortcut: capacity fade and internal resistance rise are two sides of the same aging process. A 2025 systematic analysis in the Journal of Power Sources covering 814 cells across NMC, NCA, and LFP chemistries found a strong negative correlation (r < −0.8) between capacity fade and resistance increase in over 97% of cells tested — meaning the battery management system can use resistance trend data as a continuous, low-cost proxy for capacity loss between full capacity tests.
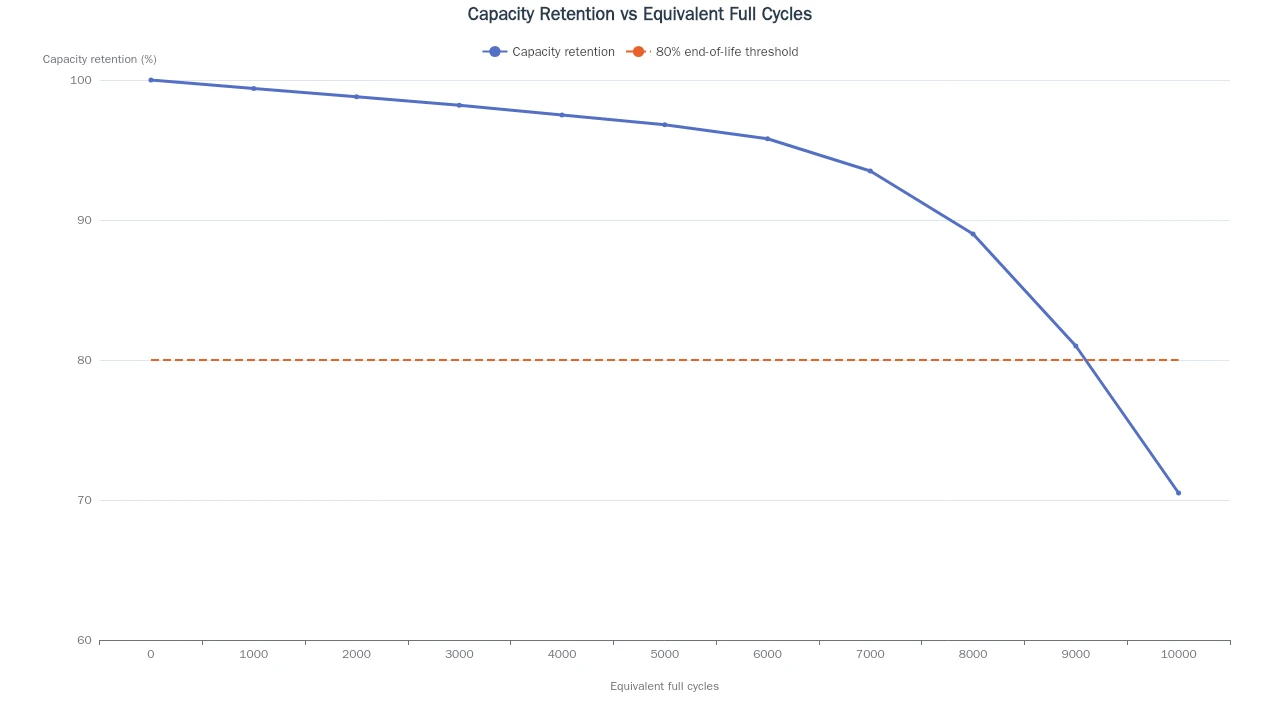
Image: illustrative capacity fade curve over equivalent full cycles — a gradual linear region, then a knee after which fade accelerates; 80% retention marks the conventional end of life.
The shape of the fade curve matters. Capacity loss is not linear: many cells show a slow, roughly linear fade for years, then a knee point after which degradation accelerates sharply. Research on capacity degradation analysis and knee point prediction describes this as a four-stage trajectory — initial decline, slow decline, transition, and high-speed decline. Predicting where the knee lands is the core problem of battery lifetime management, and it determines whether a system hits its warranty target or falls off a cliff.
Predicting Capacity Degradation
Degradation prediction sits on a ladder of increasing complexity:
- Empirical models fit simple forms to test data — calendar aging roughly follows a square-root-of-time law, while cycle aging is often modeled as linear or power-law in equivalent full cycles.
- Semi-empirical models add temperature and SoC dependence through Arrhenius-type terms, letting engineers estimate lifetime across operating conditions from a limited test matrix.
- Data-driven models (machine learning) train on large aging datasets — the 814-cell analysis above captured capacity fade within ±2.5% error down to 70% SoH and flagged resistance as a mandatory ML feature.
For an operator, the output of any model is the same: an estimate of remaining useful life and a calendar for when capacity crosses the warranty or end-of-life threshold. That estimate feeds maintenance planning and replacement budgeting. See our cycle life explainer for how cycle count and capacity retention interact in warranty language.
How Degradation Affects Storage Sizing and Economics
Capacity degradation converts directly into money in four ways:
- Warranty exposure. Storage warranties are written around capacity retention milestones (commonly 80% retention at a defined cycle count or year). Exceeding the curve means the manufacturer, not the owner, carries the loss — which is why degradation is measured, not assumed, at milestones.
- Sizing headroom. Because capacity declines over the system's life, projects are sized with a degradation margin: to deliver 10 MWh in year 10, the system may need to be built larger at commissioning. Over-provisioning costs money, so accurate degradation prediction directly trims capital expenditure.
- Revenue decay. A system earning on energy throughput delivers less usable energy each year as capacity fades. Round-trip efficiency and capacity retention together determine how much stored energy becomes revenue.
- Degradation-aware operation. An energy management system (EMS) that knows current SoH can trade a little throughput today for a much longer life — limiting SoC windows, avoiding deep DoD in low-value hours, and scheduling high-rate operation for when it pays.
The practical message for buyers: the degradation curve is a specification, not a footnote. Two quotes with identical kWh can differ by years of useful life and by hundreds of thousands of dollars in warrantied capacity — ask for the capacity retention curve, the test conditions behind it, and how the system measures SoH online.
How Hua Power Manages Capacity Degradation
Hua Power treats capacity degradation as a design parameter that is engineered at four levels rather than discovered in the field.
First, cell selection and matching. Hua Power builds on a standardized 3.2 V / 314 Ah large-format LiFePO₄ (LFP) cell; every cell is tested for capacity and internal resistance before modules are assembled. Matched cells age together — a weak cell would otherwise drag a module toward the warranty threshold early.
Second, in-house BMS hardware and firmware. The BMS enforces charge-voltage and SoC-window limits, avoids holding cells at full charge, and tracks resistance drift as an online SoH signal between capacity tests — the capacity–resistance correlation above, run as a continuous monitor rather than an annual test.
Third, thermal management as a degradation control. Liquid-cooled cabinets keep cells inside their efficient temperature band, using demand-based cooling so that the heat generated by cycling does not feed back into faster aging. Keeping the band tight keeps the degradation curve predictable.
Fourth, measured, not assumed, degradation. Capacity retention is verified against the warranty curve at defined milestones, and the engineering team publishes the measurement method and conditions so buyers can audit the numbers.
If you are comparing storage quotes, the questions worth asking are: what is the warranted capacity retention curve, what test conditions and temperature were used to generate it, and how does the system estimate state of health online? The engineering team at Hua Power answers those questions with real test data — contact us for the capacity retention data behind a specific system.