

Solar plus storage ROI is the number a developer gets asked for in a meeting, and it is usually the number nobody can defend. Ask three vendors the same question about the same building and you will get three payback figures that differ by a factor of two, all presented with the same confidence, none of them showing which assumptions were used.
The gap is not dishonesty, mostly. It is method. A payback figure built on constant savings for twenty years, with no battery degradation and no replacement cost in the analysis period and a residential export credit in the savings line, is arithmetically correct and commercially useless. The same site modelled with degradation applied every year, the mid-life augmentation payment shown as a cash outflow in the year it lands, and a discount rate stated out loud produces a different and defensible answer. That difference is what this article is about.
Solar plus storage ROI is the return on the incremental cost of adding batteries to a solar array, measured against the bill savings that storage alone unlocks. On a US commercial site those savings are demand-charge reduction, time-of-use arbitrage, and the extra self-consumption that comes from not exporting cheap. The added capex is the denominator.
The rest of this guide builds that model in the open, on one representative US commercial site, with every assumption stated. If you already have PV on the roof, the wider decision set — which retrofit route, what changes, what it costs before you run any numbers — is covered in our guide to solar retrofit battery storage. Storage is now planned grid infrastructure rather than an add-on to a generation project, which is why the US Department of Energy's energy storage programme funds it as a distinct asset class.
What Solar Plus Storage ROI Actually Measures
The confusion starts because "energy storage ROI" is used for three different calculations in the same conversation. The first is a screening ratio: total savings over the analysis period divided by net cost. The second is a payback period, the year in which cumulative savings cross cumulative cost. The third is a discounted return, either the net present value of the cash flow or the discount rate at which that value hits zero. All three are legitimate; they answer different questions, and a vendor who quotes one while you ask another is not necessarily misleading you — but you cannot approve a project on a mismatch.
Then comes the harder question: what counts as a saving. For a solar-plus-storage project on an existing array, there are four candidate battery storage revenue streams, and they are not equally bankable.
Savings line | What it is | How bankable it is |
|---|---|---|
Demand-charge reduction | Lower billed peak kW, priced at the tariff's $/kW rate | Highly bankable — it is on the bill, monthly, and verifiable from interval data |
Time-of-use arbitrage | Charge in cheap hours, discharge in expensive hours | Bankable where the tariff spread is contractual, not where it depends on wholesale prices |
Self-consumption uplift | Solar you use instead of exporting at a low credit | Bankable, and much larger where export compensation has been cut |
Grid services and demand response | Payments for capacity, ancillary services or curtailment avoidance | Real but conditional — availability, enrolment, and annual re-qualification |
Resilience and outage avoidance | Production you did not lose during an outage | Real to the business, hard to underwrite; most lenders will not count it |
The subtraction side is where optimistic models are thinnest. Added battery and conversion equipment, the labour and rework that a retrofit carries, interconnection or protection changes the utility requires, monitoring and O&M, the mid-life capacity augmentation, and financing cost all belong below the line. So does the opportunity cost of the solar-only case you are comparing against — a battery that claims credit for savings the array was already delivering is double-counting. The most common way a solar-plus-storage ROI is inflated is not a wrong formula; it is a savings line counted twice.
How to Work Out a Commercial Solar Payback Period
The solar plus storage payback period is the figure your CFO will ask for first, so start there and give it honestly.
Payback (years) = Net cost after incentives ÷ Net annual savings
Four inputs decide that number, and each one has a defensible range.
Input | What goes in it | Where it comes from |
|---|---|---|
Gross installed cost | Storage equipment, conversion equipment, EPC labour, protection and interconnection changes | Quotes, itemised; ask for the storage portion separately |
Incentive value | Tax credit at the rate your project actually qualifies for, plus any state or utility programme | Statute and programme rules for your project year |
Annual savings | Demand-charge reduction, energy arbitrage and self-consumption uplift, in dollars | Twelve months of interval data plus the tariff sheet |
Annual costs | O&M, monitoring, insurance, and an allowance for augmentation | Vendor O&M terms; do not leave this at zero |
A worked micro-example. A distribution warehouse adds a 250 kW battery to an existing rooftop array. Installed cost is $225,000. The federal credit at the qualifying rate is $67,500, so net cost is $157,500. Year-one net savings are $45,800 after O&M. Simple payback is 157,500 ÷ 45,800 = 3.4 years.
That is the number to quote in a meeting — as a screening figure, clearly labelled. It contains three assumptions that a lender will immediately test: that the savings arrive in the quantities you modelled, that they persist unchanged, and that the analysis period is long enough to matter. Payback answers "how quickly do I get my money back". It does not answer whether this is the strongest available use of $157,500, and it cannot, because it never discounts. You can see the full year-by-year build behind that figure, and the same build done properly, in the worked model below.
If you would rather base the estimate on your own bill than on a worked example, the BESS ROI calculator takes the same four inputs and returns payback, NPV and IRR.
Timing is the other half of a retrofit decision. The physical sequence — survey, protection changes, commissioning — and how long each stage takes are set out in the solar storage retrofit schedule guide.
Where the Numbers Come From: Battery Storage Cost, Bill Savings and the Tariff
Three quarters of the argument in a solar-plus-storage ROI model happens in this section, because all three input families are site-specific and all three are frequently faked.
Capex. Pricing storage by the kilowatt-hour of usable capacity is convenient and misleading, because the number changes with duration. A two-hour system and a four-hour system of the same power rating behave differently and cost differently, and the conversion equipment does not scale with energy capacity at all. Whatever a vendor's headline BESS cost looks like as a single figure, ask for it split four ways: battery block, power conversion, balance of system and EPC, and interconnection or protection work. National programmes publish and update cost benchmarks for solar and for storage, and the Department of Energy's photovoltaic cost benchmark programme is the public reference point for the generation half. The Energy Information Administration's battery storage market study is the reference for how much is being built and at what scale. Neither will price your project; both will tell you when a quote is out of range.
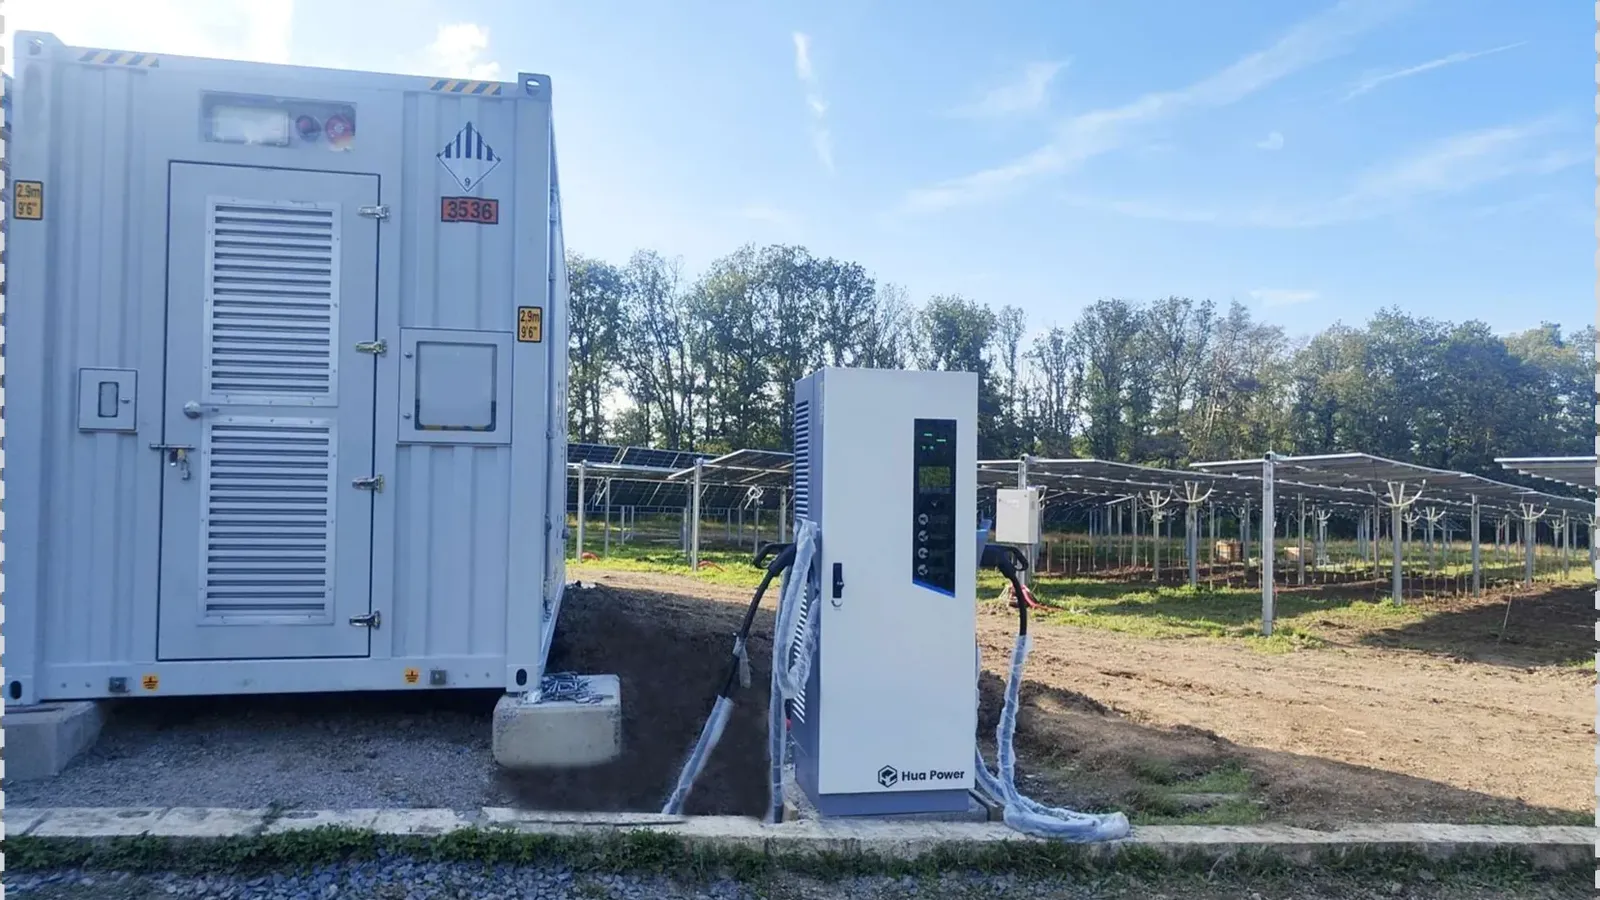
Demand-charge reduction. This is the largest and most defensible line on a commercial bill, and it is mechanical once you have the data:
Annual demand savings = kW reduction × demand charge ($/kW-month) × 12
The size of that number is decided entirely by two values you can look up rather than guess: the monthly demand charge on the tariff, and the reduction your dispatch can actually hold. A battery sized to shave a predictable afternoon peak does not shave the peak that only appears twice a year, and the billing peak is set by the single worst interval in the month.
Demand charge ($/kW-month) | 100 kW reduction | 150 kW reduction | 200 kW reduction |
|---|---|---|---|
$10 | $12,000/yr | $18,000/yr | $24,000/yr |
$18 | $21,600/yr | $32,400/yr | $43,200/yr |
$26 | $31,200/yr | $46,800/yr | $62,400/yr |
Nothing in that table is exotic; it is the tariff sheet multiplied out. The mechanism is national and it is standard: the large commercial tariffs that serve sites of this size — Pacific Gas & Electric, Southern California Edison and Con Edison among them — bill demand per kilowatt of the month's highest interval on top of the energy consumed, so the whole monthly demand line is priced by one event. The trap is not the arithmetic, it is the dispatch — a system that shaves 150 kW on paper often delivers 90 kW in practice because the control logic reacts to the peak instead of anticipating it. On a site with high demand charges, that gap is where your case lives or dies, and it is covered in detail in our guide to commercial peak shaving savings.
Energy arbitrage and self-consumption. The second savings line is the spread between the price of the electricity you would otherwise buy and the value of the electricity you would otherwise export or curtail. Both halves of that spread must come off the tariff and the settlement rules, not from a generic average. Discount the modelled arbitrage by roughly a third as an engineering margin, and remember that every kilowatt-hour that comes back out of the battery has already lost some of the kilowatt-hour that went in: the round-trip efficiency loss is a permanent discount on this line, not a one-off commissioning detail.
Direction of travel matters too. Historically the installed-cost decline in the US has been fastest in the utility-scale segment while commercial and residential costs have been stickier — that was the finding of the national-laboratory installed-cost work reported in 2021 by Energy-Storage.news, and it is cited here as a dated data point rather than as a 2026 forecast. If a vendor's capex figure is three years old, on either side of that trend, the payback it produces is not a forecast — it is an artefact.
IRR, NPV and LCOS: Picking the Honest Yardstick
Simple payback has one structural flaw: it treats a dollar of savings in year two and a dollar in year twenty as the same thing. They are not, and the difference is not academic. Our model produces $60,269 of net savings in year twenty. Discounted at 8%, that money is worth about $12,930 today. Once discounted, the nineteenth and twentieth years contribute almost nothing to the value of the decision, and a metric that cannot see that cannot be used to allocate capital.
Yardstick | What it answers | Who asks for it | Where it fails |
|---|---|---|---|
Simple payback | How fast does the cash come back | Facilities and operations leadership | Ignores the time value of money and everything after the crossover year |
Discounted payback | How fast does the cash come back in today's money | Finance teams comparing projects | Still ignores everything after the crossover year |
NPV | How much value does this create, in today's money | Anyone allocating a capital budget | Sensitive to the discount rate you choose; says nothing about scale |
IRR | At what rate does this capital compound | Boards and lenders with a hurdle rate | Flatters short, high-return projects and assumes reinvestment at the same rate |
LCOS | What does a delivered kilowatt-hour cost this asset | Engineers and analysts comparing technologies | A cost metric, not a return metric — it cannot tell you whether the project is worth doing |
Discounting requires one number you must choose and disclose: the hurdle rate. Use your weighted average cost of capital if you have one; use a corporate hurdle rate if your treasury publishes one; do not use the battery's warranty period as a way of avoiding the question. The rate at which the discounted cash flow reaches zero is the energy storage IRR a lender or a board will test, and it is the figure to quote when someone asks what the project returns rather than how fast it pays back. The levelized cost of storage is the engineer's yardstick and a genuinely useful one, but it answers a different question — what a delivered kilowatt-hour costs — and the methodology behind it is set out in the site's own explanation of how LCOS is calculated. Lazard's Levelized Cost of Energy+ analysis is the widely cited public source for both generation and storage cost curves, and Lawrence Berkeley National Laboratory's utility-scale solar data update tracks what the same economics look like at the generation end of the market, where solar-plus-storage has become the standard configuration rather than the exception.
What Moves the Answer Most: Degradation, Cycling and Augmentation
If you change one assumption in a solar-plus-storage ROI model, change this one: assume the battery delivers less every year, and budget for the year it gets topped up.
Batteries fade. A commercial LFP cabinet rated for 8,000 cycles at 80% state of health will still be inside its warranty envelope after eight thousand cycles — but the envelope is defined at a stated depth of discharge, a controlled temperature and a defined throughput. Push the depth of discharge, run in a hot enclosure, or cycle twice a day and the fade arrives sooner. Degradation is not a rounding error to be mentioned in a footnote; it is a percentage that removes a growing slice of the savings line every year, and it interacts with everything else because a weaker battery shaves less peak and shifts less energy.
The second omitted assumption is the augmentation payment. A twenty-year analysis on a battery with a ten-to-fifteen-year effective service life has an event in it, and that event is a cash outflow — new modules, or a second unit, or a derated dispatch strategy. Models that simply extend year-one savings across twenty years are not being conservative; they are ignoring a payment.
Here is what that costs on identical hardware. Take the same twenty-year cash flow, and compute the total return multiple two ways:
Method | 20-year total savings | Return multiple on net cost | What changed |
|---|---|---|---|
Constant year-one savings, no degradation, no augmentation | $916,000 | 482% | The default method in most published payback guides |
No rate escalation, degradation applied, augmentation payment included | $711,107 | 351% | The two assumptions a reader can actually verify |
That is a 131-percentage-point move produced entirely by two assumptions, on a project whose hardware never changed. Neither number is "wrong" in the sense of an arithmetic error. They are answers to different questions, and only one of them is a question a lender will accept. Whether your assumptions are defensible depends on the cycle-life basis behind them — cycles at what depth, at what temperature, at what end-of-life capacity.
A Worked US Commercial Model, Assumptions Stated
This is the part the ranking pages do not publish. Everything below is this article's own modelling assumption for one representative site, computed from the numbers in the first table, and it is stated rather than implied so that you can substitute your own and re-run it.
The site. A 500 kW commercial rooftop array already installed, a winter peak demand of 500 kW, a summer peak of 640 kW, and a monthly demand charge set mid-way through the three cases the sensitivity table tests. The decision in front of the owner is the incremental battery only — the array is sunk cost and gets no credit, which is why the solar retrofit payback period here is not comparable with the payback the array itself once showed.
Assumption | Value | Why this value |
|---|---|---|
Added storage | 250 kW of power, about 434 kWh usable — two 125 kW / 241 kWh AC-coupled cabinets, 482 kWh of nameplate capacity at the 90% depth of discharge assumed below | Sized for a two-hour peak window, not for full-site backup |
Round-trip efficiency | 85% | Low end of what commercial LFP cabinets publish, so the model errs against itself |
Depth of discharge | 90% | Standard commercial dispatch window |
Installed cost | $225,000, itemised | This article's assumption, about $467 per kWh of nameplate capacity for a two-cabinet retrofit. It is the input a vendor controls, so replace it with your own itemised quote before relying on anything downstream |
Federal tax credit | 30% of capex — $67,500 | The qualifying rate, applied once, with the conditions discussed below |
Net cost | $157,500 | Capex less the credit |
Demand charge | $18 per kW-month | This article's assumption, chosen between the $10 and $26 cases tested below. Read the figure off your own tariff sheet — it is the largest single swing factor in the result |
Peak reduction delivered | 150 kW | Sized from interval data and held through dispatch, not the site's nameplate peak |
Energy savings | $16,800 in year one | Time-of-use arbitrage plus self-consumption uplift, after an efficiency margin |
O&M | $3,400 in year one, escalating 2% | Roughly 1.5% of installed cost |
Retail rate escalation | 3% per year | Compounded; disclosed because escalation is what makes year twenty matter |
Battery degradation | 2% per year of the storage-linked savings | Applied to the demand and energy lines, not to the whole bill |
Augmentation | $60,000 in year 11 | Partial repowering — restores usable capacity to 90% of year-one capability, shown as a cash outflow in the year it lands |
Federal tax rate | 21% | Used to value the depreciation shield only, and assumes the owner has taxable income to absorb it |
Depreciation | Five-year MACRS, half-year convention (20 / 32 / 19.2 / 11.52 / 11.52 / 5.76%) | Applied to capex less half the credit, because the credit reduces the depreciable basis |
Analysis period | 20 years | Matched to the longer-lived asset, not the battery |
Discount rate | 8% | A hurdle rate the reader can argue with, which is the point |
Now the cash flow. Read the year-eleven row carefully — that negative figure is the augmentation year, and it is the row every undiscounted model is missing.
Year | Demand savings | Energy savings | O&M | Augmentation | Net cash |
|---|---|---|---|---|---|
1 | $32,400 | $16,800 | -$3,400 | — | $45,800 |
2 | $32,705 | $16,958 | -$3,468 | — | $46,194 |
3 | $32,998 | $17,110 | -$3,537 | — | $46,571 |
5 | $33,549 | $17,396 | -$3,680 | — | $47,265 |
8 | $34,269 | $17,769 | -$3,906 | — | $48,133 |
10 | $34,665 | $17,975 | -$4,063 | — | $48,576 |
11 | $34,834 | $18,062 | -$4,145 | -$60,000 | -$11,248 |
12 | $40,364 | $20,930 | -$4,227 | — | $57,066 |
15 | $41,461 | $21,498 | -$4,486 | — | $58,473 |
20 | $42,951 | $22,271 | -$4,953 | — | $60,269 |
The jump in year twelve is the augmentation working, not a rounding artefact: the model restores usable capacity to 90% of its year-one capability at that point, so the demand and energy lines recover before escalation carries them higher again. An augmentation that only replaced failed modules, without restoring capacity, would leave the savings lines flat instead.
What the model returns.
- Simple payback: 3.4 years (net cost ÷ year-one net savings).
- Discounted payback at 8%: 4.1 years.
- NPV at 8% over 20 years, including a depreciation tax shield valued at an assumed 21% federal corporate rate: $343,499.
- IRR: 33.4% including the depreciation shield, 29.2% on pre-tax cash alone.
- Twenty-year cumulative net cash: $991,224.
The gap between 3.4 and 4.1 years is the cost of the discount rate, and it is the number to put next to the simple payback any time someone presents only one figure.
What the answer is sensitive to. Run the same model with different inputs, and test the answer the way a lender will. The table below shows the two payback measures this article defined earlier side by side — the payback period, which is the year cumulative savings cross net cost, and the simple payback, which is net cost divided by year-one savings. They are not the same measurement, and on one row they are not even close:
Change | Payback (years until cumulative cash crosses net cost) | Simple payback (net cost ÷ year-one savings) |
|---|---|---|
Base case (30% credit, $18/kW-month) | 3.4 years | 3.4 years |
Credit at the 6% base rate instead of the qualifying rate | 4.6 years | 4.6 years |
No credit at all | 4.8 years | 4.9 years |
Demand charge $10/kW-month | 4.9 years | 5.0 years |
Demand charge $26/kW-month | 2.6 years | 2.6 years |
Energy arbitrage and self-consumption value only — no demand-charge savings | 14.9 years | 11.8 years |
Read the left-hand column as cash flow: it carries rate escalation, degradation applied every year, and the $60,000 augmentation payment landing in year eleven. Read the right-hand column as the screening arithmetic from the payback section above, which stops at year one and therefore sees neither the augmentation nor the escalation. On five of the six rows the two agree to within a tenth of a year. On the last row they diverge by more than three years, and the augmentation accounts for the whole of it: strip that single $60,000 outflow out of the row and the running balance crosses close to the year-one ratio again. Quote the left-hand column when you are defending the cash flow, and quote the right-hand one only as the screening figure it is.
The last row is the verdict on site selection. On a tariff with no meaningful demand charge and a narrow peak-to-off-peak spread, storage added to an existing array is not a payback project at all; it is a resilience purchase that has to be justified on other grounds. Solar-plus-storage ROI does not fail at the battery. It fails at the tariff.
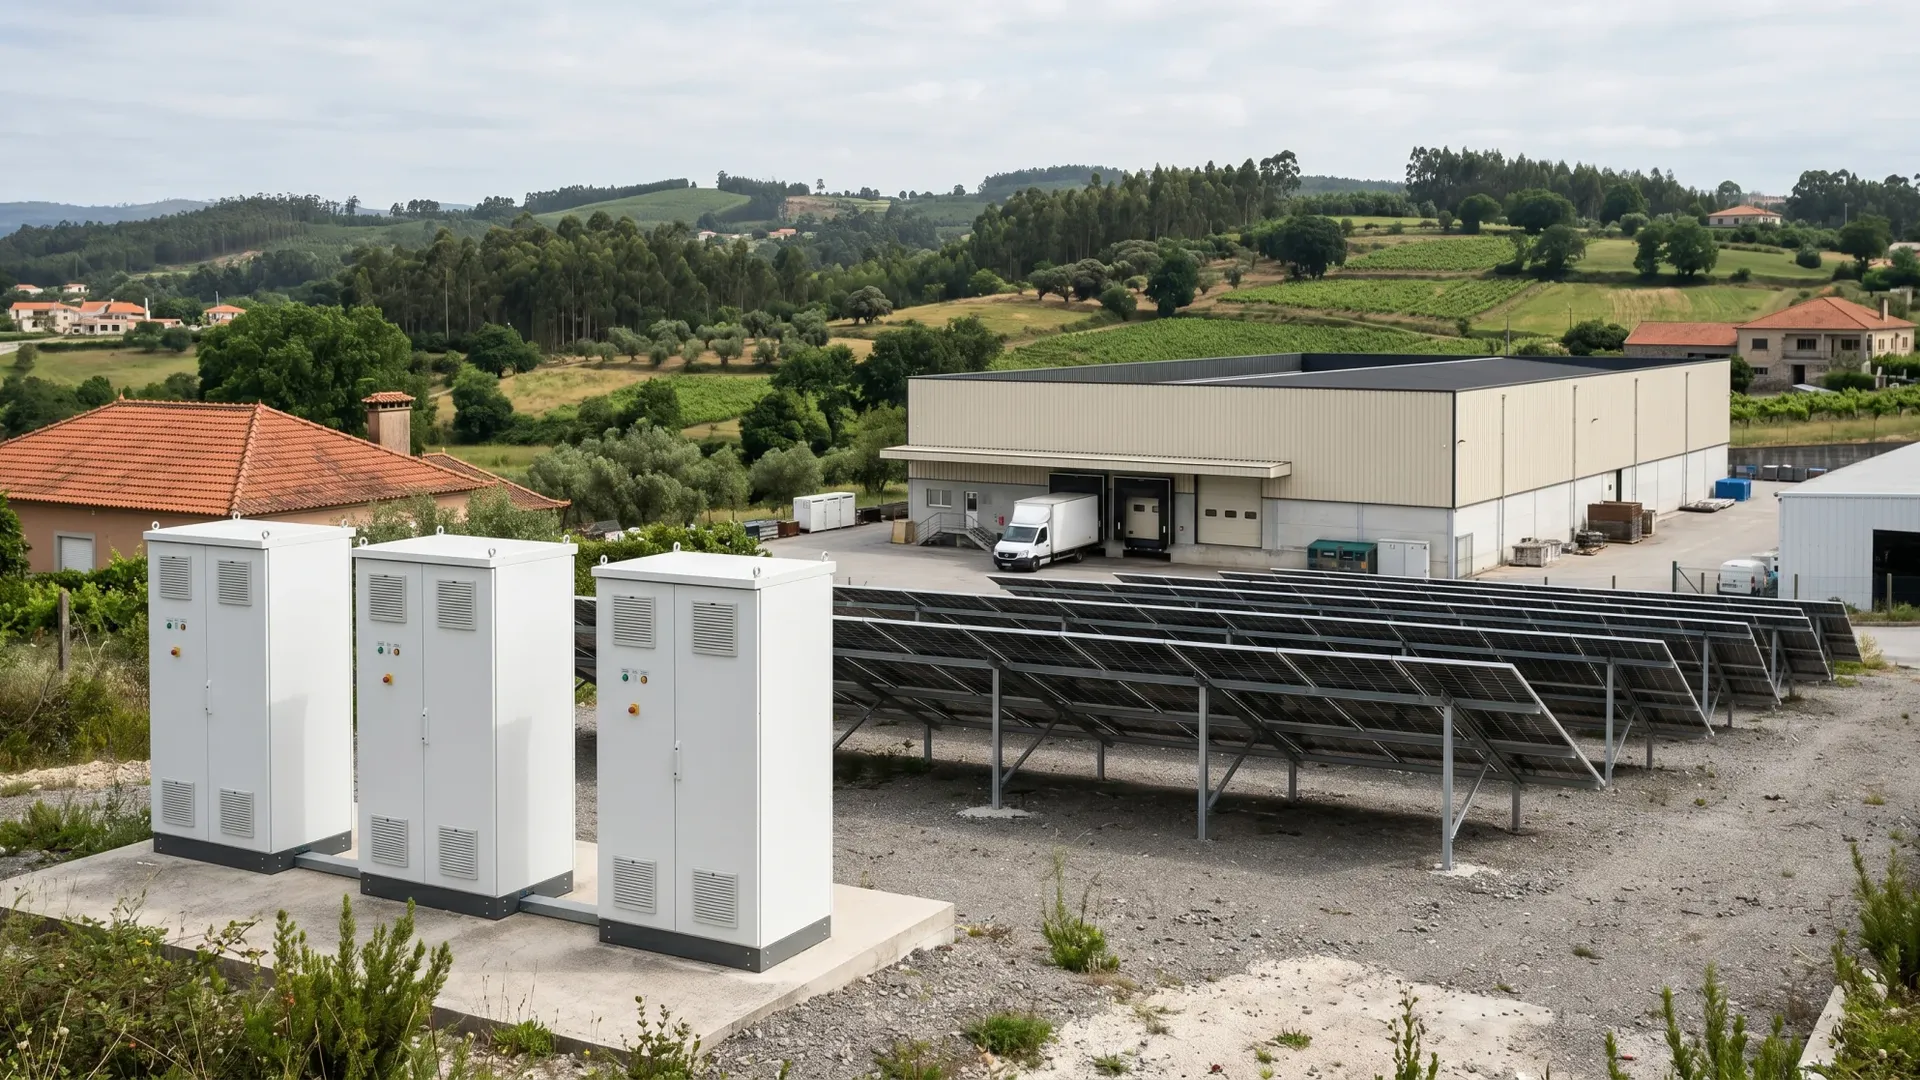
For the retrofit case specifically, what the incremental capex buys is the equipment that connects on the AC side of the existing inverters, so the array and its inverters stay exactly as they are. The picture above is a delivered site of that shape — storage cabinets on a pad beside a ground-mounted array — and it is the shape this model prices, not that particular hardware: the AC-coupled storage cabinet specification is a concrete example of the unit, 125 kW and 241 kWh in one cabinet, so 250 kW of power is two of them, or one higher-capacity cabinet from the same range. That is also why the conversion equipment is priced separately from the battery block.
Why a Residential Solar Panel Payback Period Doesn't Transfer
Most published payback figures for solar-plus-storage come from the residential market, and the AI overviews that quote a payback formula quote the residential one. Three differences make that figure unusable on a commercial site.
Residential economics leans on export compensation, and in the largest solar market that compensation has been cut hard. California's net billing tariff pays for exported generation at a value reflecting its worth to the grid, which is generally below the retail rate, and the state's regulator's own guidance is that customers maximise bill savings by pairing storage with generation so they can use the energy during high-value hours — see the CPUC's net energy metering and net billing page. Commercial sites were never on retail-rate net metering in most territories, so the same policy shift changes their numbers far less than the residential headline implies.
Second, residential tariffs have no meaningful demand charge. The largest single commercial savings line simply does not exist in a household bill, which means a residential payback calculation is modelling a project with one lever while a commercial project has two.
Third, scale changes the cost basis and the load factor. A 250 kW commercial system spreads EPC, protection and interconnection cost over ten times the capacity of a home system, and it runs a predictable weekday load profile that a dispatch algorithm can actually exploit. A residential figure is not a conservative version of a commercial figure. It is a number about a different asset — which is visible in the difference between this article's model and the worked example on the site's own delivered 500 kW / 1,075 kWh commercial project.
Incentives and Financing: What Changes the Net Cost
The federal credit is the single largest lever on net cost, and it is the section where published payback figures are most often wrong in the project's favour.
The clean electricity investment credit under section 48E — the investment tax credit, or ITC, in its present form — is technology-neutral and explicitly covers energy storage, not only generation. Its base rate is 6%, and a 30% rate is available to projects that qualify — which includes energy storage with a capacity of less than one megawatt, and projects that meet the prevailing wage and registered apprenticeship requirements. Bonus adders can increase the rate further for domestic content and for projects in designated energy communities. The IRS publication for tax-exempt entities and the investment credit, Publication 6045, sets out which technologies are eligible and how the credit is calculated against tax basis. Two consequences follow for your model: the credit rate is not a constant to be assumed at 30% without checking the qualification path, and the ceilings and the construction-start rules that apply depend on your project year. Confirm the rate and the eligibility path for your specific project with a tax adviser before you build it into a board paper.
Depreciation runs in parallel. Storage is depreciated on a five-year MACRS schedule under the half-year convention, and the credit reduces the depreciable basis by half the credit amount — a detail that quietly changes the value of the depreciation benefit. In this model the present value of that benefit is around $33,000, which is why the IRR including it (33.4%) sits above the pre-tax cash IRR (29.2%) — and why the shield is worth nothing at all to an owner with no taxable income to absorb it. State and utility programmes stack on top, and the Database of State Incentives for Renewables and Efficiency is the standard place to check what applies in your territory.
Then there is the contract route, which changes who owns the return. An outright purchase captures every incentive and every dollar of savings, and carries the performance risk. A power purchase agreement or an energy-storage-as-a-service contract moves the capex off your balance sheet and converts the return into a fixed discount to your bill — a lower percentage return to you, and a far lower capital requirement. Neither is a better answer in the abstract. The honest framing is that a 25% IRR on money you have to raise is a different proposition from a 12% saving on money you do not, and there is no way to compare them without stating the hurdle rate and the cost of capital on both sides.
How to Pressure-Test a Vendor's ROI Claim
Take the model above and use it as an interrogation script. Seven questions separate a projection from a plan.
- What is the net cost after incentives, and at what credit rate? If the answer is a 30% credit with no reference to the qualification path, the payback is optimistic by roughly a year, as the sensitivity table shows.
- Show the demand-charge reduction with the interval data behind it. Ask for the specific 15-minute intervals the dispatch is designed to cover, and the kW figure it holds — not the site's peak.
- What degradation is applied, and on which savings line? "Negligible" is a red flag. A percentage applied to the whole bill instead of to the storage-linked savings is a second one.
- Is there a replacement or augmentation payment in the analysis period, and in which year? If the analysis runs twenty years with no such payment, ask what the warranty throughput allows in year twelve.
- What discount rate was used, and what are the NPV and IRR? A vendor who cannot produce a discounted figure has produced a screening estimate, which may be fine — but it cannot be signed.
- What happens to the numbers if the demand charge is 40% lower, or if the credit falls to the base rate? The sensitivity table is two minutes of work in a spreadsheet; a supplier who cannot produce it does not know the project's risk.
- What is the performance guarantee, and what does it cover? Capacity, round-trip efficiency and availability are three different warranties. Get the measurement conditions in writing — and see the commissioning evidence that the delivered system meets them, because that is the evidence that the modelled performance exists outside the model.
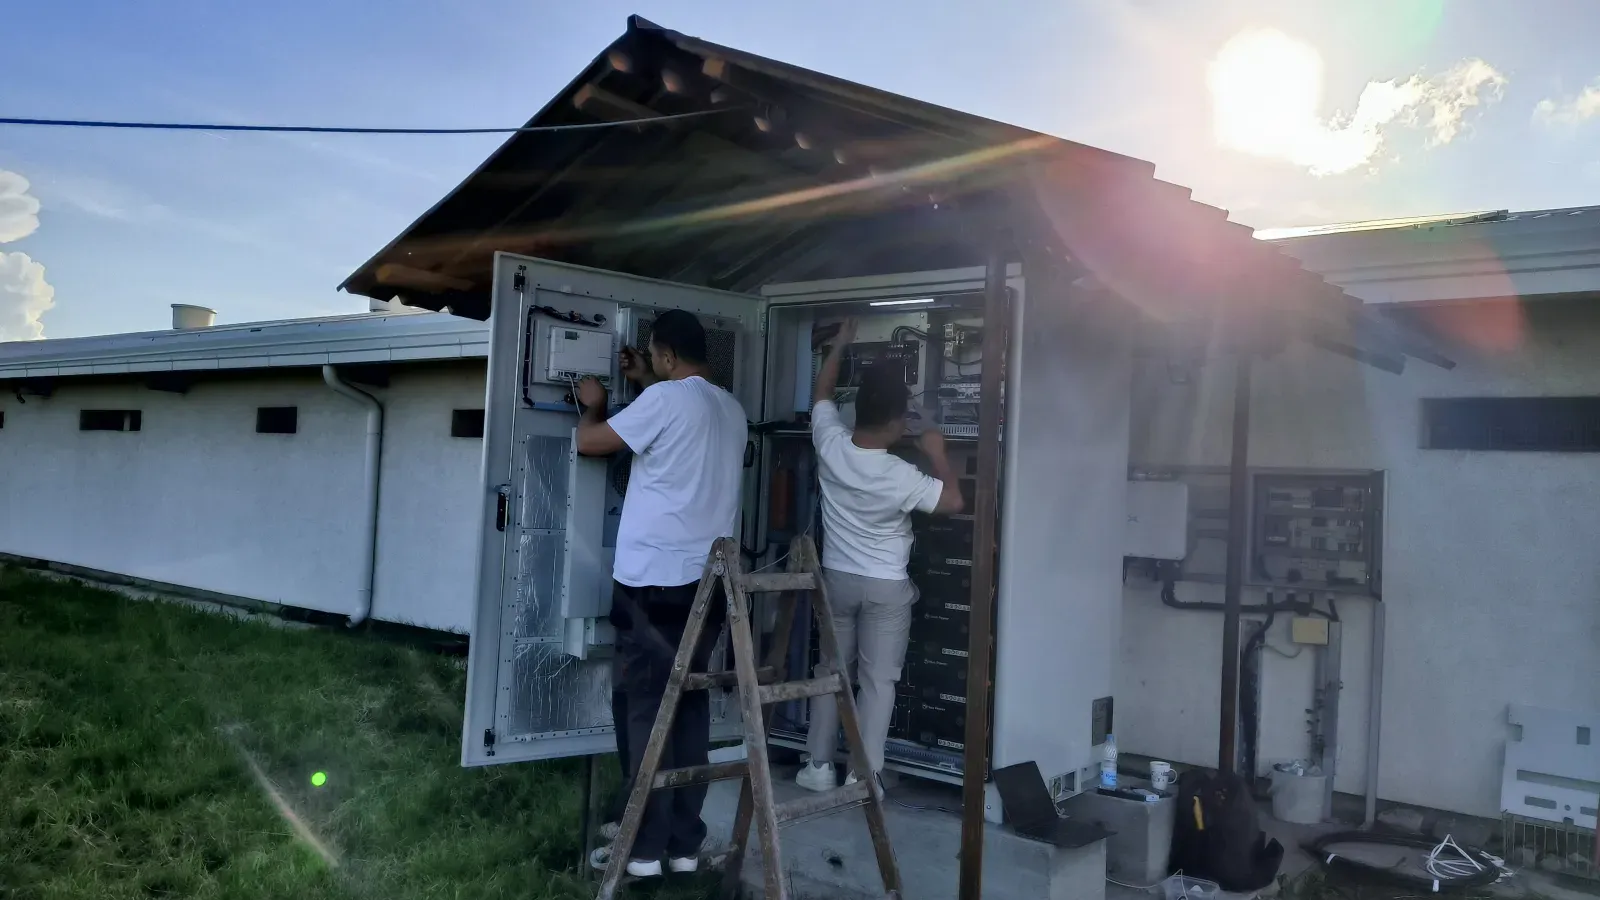
That list is the return-focused half of a larger exercise. Factory audit, certification evidence and test data belong alongside it, and they are laid out in this site's C&I battery storage procurement guide.
Common Ways Solar Plus Storage ROI Gets Overstated
Six errors account for most of the gap between a vendor's payback figure and a bankable one.
- Constant savings for twenty years. No degradation, no escalation, no change in tariff. Two of those three assumptions are wrong, and they push in opposite directions — which is exactly why the number looks plausible and the model is still useless.
- The augmentation year is missing. A twenty-year analysis of a fifteen-year asset has a payment in it. Removing that payment is the single most effective way to improve a payback figure without changing anything on site.
- The credit is claimed at the qualifying rate with no qualification path. The difference between 30% and 6% is more than a year of payback on our model.
- Demand-charge reduction is modelled at the nameplate peak. The billing peak is one interval per month, and dispatch that reacts rather than anticipates captures a fraction of it.
- Savings the array was already delivering are credited to the battery. Self-consumption that already existed has no incremental value. Only the change counts.
- Resilience and grid-service revenue are mixed into the base case. Both are real; both are conditional. Present them as upside above a fully evidenced base case, not inside it.
The common thread is that none of these is arithmetic fraud. Every one of them is an assumption left unstated — which is the actual failure. A model that declares its assumptions can be argued with, corrected and approved. A payback figure that arrives without them cannot be.
FAQ
Is battery storage a good investment? For a commercial site with a meaningful demand charge and a wide peak-to-off-peak spread, adding storage to an existing array commonly clears a hurdle rate: in the model above, a 3.4-year simple payback and a 29% pre-tax cash return over twenty years. On a flat-rate tariff with no demand charge, the same hardware returns a 14.9-year payback on the running cash balance — 11.8 years on the year-one ratio — and is better justified as resilience than as an investment. The investment quality is a property of the tariff, not of the battery.
How long will a 20 kWh battery last? Capacity fades with both throughput and calendar age, so the honest answer is a curve, not a date. A well-managed LFP system losing around 1.5–2% of usable capacity per year will reach roughly 60–70% of its nameplate capacity within twenty years, and commercial cabinets are warranted against a throughput allowance as well as a term. Ask for cycles at a stated depth of discharge and temperature, and treat any single-category answer as marketing.
What is a good payback period for a commercial solar-plus-storage project? There is no universal threshold, but there is a defensible shape: under five years is generally judged on the savings alone, five to ten years increasingly needs stacked revenue or an escalating tariff behind it, and beyond ten years the business case has usually become a resilience or emissions case. Whatever the number, present it with the discount rate beside it.
Do you need a battery for solar to pay off? No — but where export compensation has been cut, solar-only economics degrade sharply and storage becomes the main lever. The CPUC guidance in California is explicit that pairing storage with generation is how customers keep bill savings under net billing. On a commercial site with a demand charge, that lever is worth several times more than it is in a home.
How do you calculate solar plus storage ROI? Net cost after incentives, divided into net annual savings, gives simple payback. The same cash flow with degradation and augmentation applied and discounted at your hurdle rate gives NPV and IRR, which are the figures a lender or an investment committee will underwrite. Compute all three, state the assumptions in a table, and test the result against a demand-charge sensitivity.
Does resilience count in the ROI? It is value, but it is not cash, so keep it out of the base case. If losing production for four hours costs the business a quantified figure, model that saving as a separate line and label it as avoided loss rather than as revenue. If it cannot be quantified, treat it as the reason the project is safe rather than as part of the return.
Turning the Energy Storage Business Case Into a Decision
The purpose of all of this is not to produce a more conservative number. It is to produce a number that survives being questioned by someone whose job is to question it.
Start from your own twelve months of interval data and your own tariff sheet, because every input that matters is on those two documents. Fix the four input families from the tables above, then add the three things most models leave out: degradation applied every year to the storage-linked savings, an augmentation payment in the year it lands, and a stated discount rate. If the project still clears your hurdle rate, you have a decision rather than an argument — and the sensitivities will tell you which single assumption you should go and verify before you buy.
Hua Power builds the battery side of these projects, from the AC-coupled cabinets used to add storage to an existing array through to containerised systems for larger sites. If you want the capex side of this model populated with real, itemised numbers for your site rather than a benchmark, send us the load profile and the tariff and we will price the storage portion of it.