

Why 10 MW is the scale California's storage boom leaves out
California ended 2025 with 16,942 megawatts of battery storage online — more than any other state, and second only to China worldwide, according to the California Energy Commission. Read the headlines and you would think every California battery storage project is a 250 MW utility block: Compass Energy Storage at 250 MW, Corby at 300 MW, and SCE's Reliability Utility-Owned Energy Storage (RUOES) portfolio at 537.5 MW.
The projects actually being developed by mid-size players — community choice aggregators, C&I energy services firms, independent developers, and EPCs — are a different animal. A 10 MW battery storage project, typically 20 to 40 MWh, sits in a segment that has almost no public reference material. The state's own fleet data shows why the segment matters: of the 16,942 MW installed, roughly 13,880 MW is utility-scale front-of-meter, but more than 3,000 MW sits behind the meter at homes, businesses, schools, and local government sites — a market built one mid-size project at a time.
This case study fills that gap. It walks through a representative 10 MW / 20 MWh project from site selection to commercial operation, using public market data from CAISO, the CPUC, and the California Energy Commission. The project profile below is a composite built from publicly documented market conditions — not a specific client installation, and no customer or investment figures are invented. If you are sizing, budgeting, or scheduling your own 10 MW project in California, this is the roadmap the developer pages and press releases never give you. For the broader U.S. market context, our Battery Storage in the USA hub collects the market and compliance guides in one place.
The representative project: 10 MW / 20 MWh, two-hour, LFP
Before the process, the profile. The representative project this case study follows is:
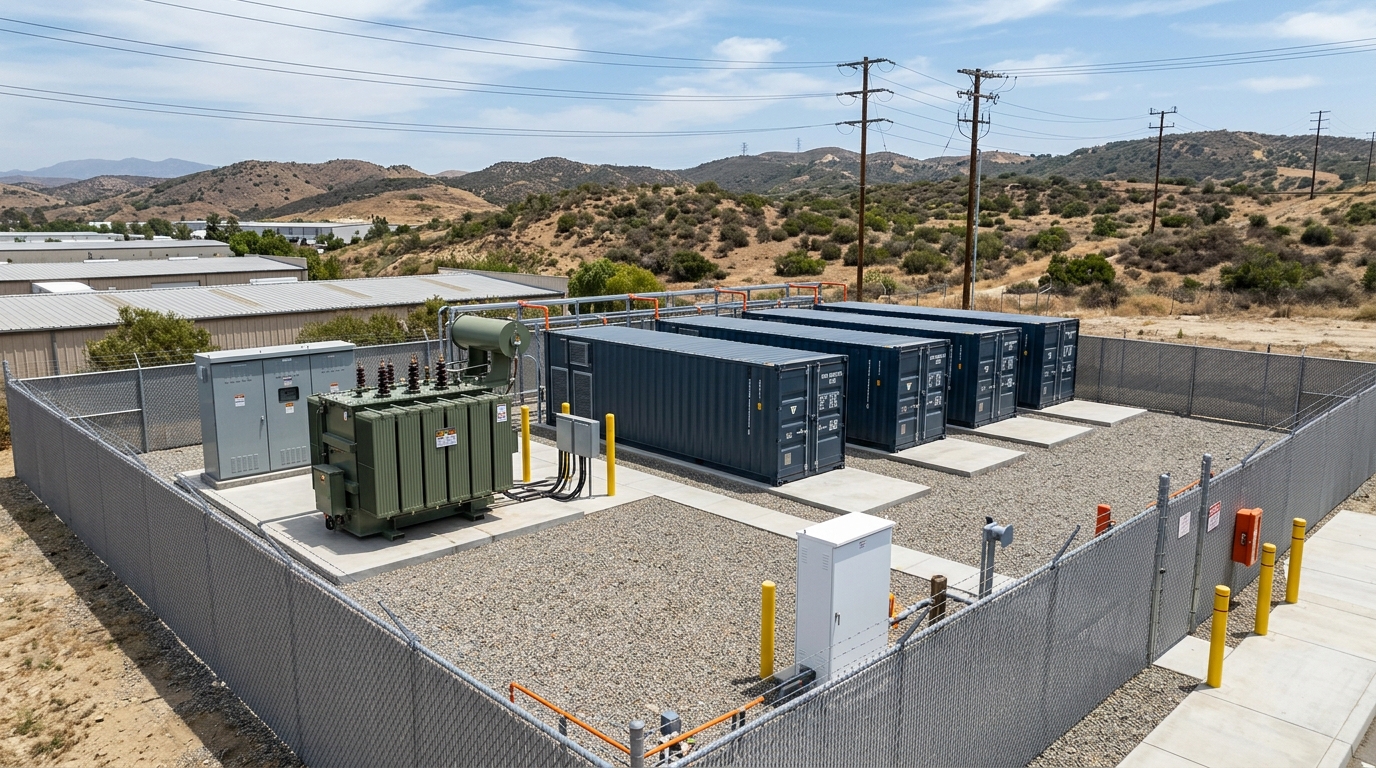
- Rating: 10 MW AC / 20 MWh, two-hour duration, LFP chemistry
- Equipment: four 5 MWh-class liquid-cooled container BESS units (20-foot-class enclosures) plus PCS, medium-voltage transformer, and switchgear
- Site: roughly half an acre of disturbed land in an industrial zone, near an existing substation
- Interconnection: distribution-level interconnection through the local investor-owned utility, or a small-scale CAISO generation interconnection if the project sells into wholesale markets
- Business model: energy arbitrage and grid services during the evening peak ramp, with optional behind-the-meter demand-charge management where tariffs reward it
A representative 10 MW / 20 MWh site: four 5 MWh-class liquid-cooled containers, transformer, and switchgear on a compact industrial parcel.
Two-hour duration is the base case because it matches the evening-peak arbitrage window that drives most mid-size projects today. Four-hour (10 MW / 40 MWh) variants exist and are increasingly favored where the project can qualify for resource adequacy capacity payments — we return to that choice in the economics section. Chemistry is LFP for the same reason every serious vendor ships it in this segment: lithium iron phosphate cells combine 8,000+ cycle life, 90% depth of discharge, and the thermal stability that fire marshals and insurers actually want to see on paper.
Why California, why now: the market mechanics behind the case
Three structural forces make the 10 MW segment work in California in a way it does not in most states.
The fleet is real and still growing. California went from about 500 MW of battery storage in 2018 to more than 13,300 MW by 2024, and the state projects 52,000 MW will be needed by 2045 to hit its clean-energy targets, per the state's business development agency. The 16,942 MW online today is roughly one-third of that 2045 goal — the buildout is a third of the way there, with the remaining two-thirds still ahead.
The grid's daily shape pays for storage. California's solar fleet overgenerates at midday and the grid needs fast-ramping capacity in the early evening. Storage is the bridge: charging when solar is cheap and abundant, discharging when the ramp hits. The state has not issued a single Flex Alert since 2022 — an emergency call for voluntary conservation — through record heatwaves, because battery dispatch now covers roughly a quarter of peak demand for several hours at a stretch. Grid operators, utilities, and regulators all describe the same job for storage: keep the evening ramp covered without new gas peakers.
Costs keep falling. The CEC, citing IRENA data, notes battery storage costs have fallen about 93% since 2010. The CAISO grid operator — which serves roughly 80% of California's electricity consumers — now dispatches battery storage as a routine part of the daily ramp, not an experiment. For a mid-size developer, that means the market structure — not a pilot program — is the reason to build.
None of this is a secret. What is missing is the how: the interconnection queue, the permit stack, the equipment spec, and the revenue math for a 10 MW project. That is the rest of this article.
Step one: interconnection — the schedule is set by the grid operator, not you
The single most common planning error on a 10 MW California project is treating interconnection as a technical formality. It is the critical path, and its duration is largely outside your control.
Which process applies. A 10 MW project sits below the threshold that triggers the CEC's streamlined "opt-in" certification — that program, created by AB 205, exists for energy storage facilities of 200 MWh or more, which is why the Compass Energy Storage project (250 MW / 1,000 MWh, LFP, San Juan Capistrano) goes through the CEC while your 20 MWh system will not. Instead, a 10 MW plant interconnects through one of two routes:
- Distribution-level: through the local utility (PG&E, SCE, SDG&E) as a distributed energy resource. Simpler studies, but the utility controls the queue and the upgrade requirements.
- Wholesale: through the CAISO generation interconnection process, which gives direct market access for energy arbitrage and ancillary services but adds queue timing and study costs.
The realistic timeline. From interconnection application to interconnection agreement, plan for 18 to 36 months. The queue is congested; study results, cost allocation, and any required grid upgrades all add months. The strategic implications are blunt: start the interconnection process before you finalize equipment, hold land options that outlive the queue, and put a contract structure in place that survives schedule slips. The developers who fail at 10 MW almost always fail here — they size and order equipment first, then discover the grid says two years.
Step two: permits, incentives, and the compliance stack
While interconnection runs, the compliance work proceeds in parallel. For a 10 MW site in an industrial zone, the stack looks like this:
Land use and environmental. A county or city discretionary permit, often with a conditional-use permit review. Depending on the site and jurisdiction, portions of CEQA review can apply — a mitigated negative declaration is common for fenced, non-occupied storage sites. This is where community engagement matters: California's new Senate Bill 283 requires developers to work with local fire authorities on facility design and emergency response plans, and the state runs a Battery Storage Safety Collaborative that signals how seriously local agencies take these reviews. Budget for the community process; on mid-size projects it is often the difference between a 6-month and an 18-month permit.
Fire and electrical code. California's fire code and NFPA 855 — the Standard for the Installation of Stationary Energy Storage Systems — govern separation distances, ventilation, suppression, and emergency access. The CPUC set new BESS safety standards in early 2025, and the California Fire Code update that year added enhanced BESS requirements. The practical consequence: your equipment's UL 9540A test report — the large-scale fire test data behind UL 9540 listing — is a siting input, not a paperwork item. A well-documented report can justify reduced separation distances; a weak one can force a layout that does not fit your parcel. We published a full UL 9540A verification walkthrough in this cluster that covers exactly how to check a vendor's report before you sign.
Incentives. Two programs matter at this scale. First, the federal investment tax credit: the Inflation Reduction Act's expansion made standalone storage eligible for the Energy Investment Credit, up to 30% of qualified costs (the full 30% rate is tied to prevailing-wage and apprenticeship requirements; the base credit is 6%). Second, the CPUC's Self-Generation Incentive Program (SGIP) — but read the eligibility carefully. SGIP's 2025 incentive rates (\$1,100/kWh residential equity storage, \$850/kWh non-residential equity, through 2025) are aimed at behind-the-meter systems in disadvantaged communities, with a demand-response enrollment requirement. Most 10 MW front-of-meter projects will not qualify; the ITC plus wholesale revenues carry the economics instead.
Step three: equipment — what a bankable 10 MW BESS ships with
With the schedule and compliance picture clear, the equipment decision becomes a specification exercise, not a shopping trip. For 20 MWh of storage, the arithmetic is simple: four 5 MWh-class liquid-cooled containers, each with integrated battery racks, BMS, thermal management, and fire suppression, paired with PCS and a step-up transformer. The industry-standard envelope today is the 20-foot container at 4 to 5 MWh — the same form factor every utility-scale fleet in California deploys, just in smaller numbers.
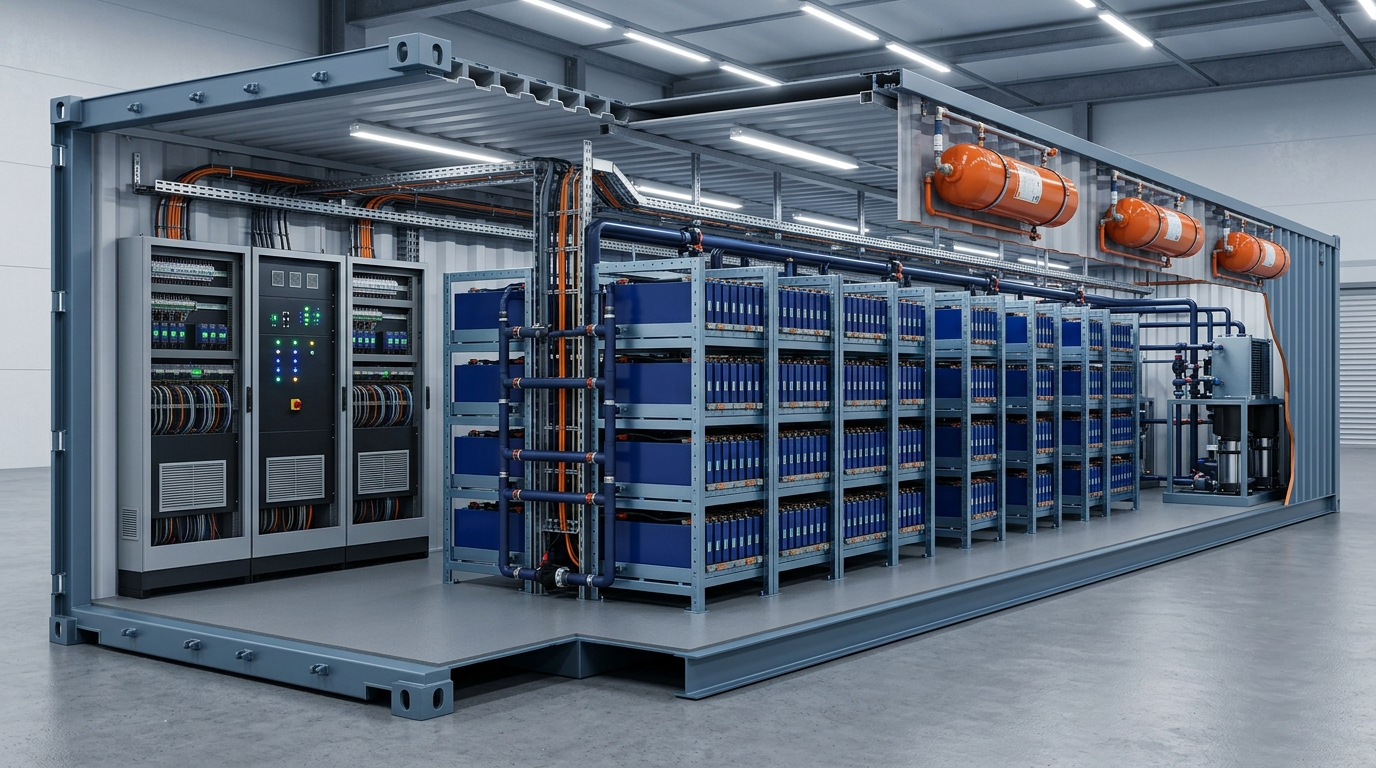
Three specifications separate a bankable mid-size system from a problem:
- Thermal management. Liquid cooling keeps cell temperatures uniform — the ±2°C class — which protects both efficiency and calendar life. Air-cooled systems work in mild climates; California's inland sites see −5°C to 45°C+ swings, and the thermal-management layer is what keeps the system inside its warranty envelope across that range.
- BMS with runaway detection. The battery management system should watch cell voltage, temperature, and gas detection, and it should do so at the pack level with real detection speed. Fire-safety layers — aerosol or clean-agent suppression, pressure relief, explosive venting — only matter if the BMS gives them a few seconds of warning.
- Documentation. The UL 9540A report with a number, an issuing lab, and an edition date; UL 9540 listing; UL 1973 cell/pack certification; UN 38.3 transport certificates. The whole compliance stack from step two resolves or collapses on this paperwork.
What a bankable container ships with: LFP racks, liquid cooling, BMS, and suppression inside a 20-foot enclosure.
Hua Power's energy storage container line — the 2 MWh HC-UPSA2089L through the 5.01 MWh HC-UPSB5010L liquid-cooled units — is representative of what the equipment spec looks like at this scale: LFP cells, 90% depth of discharge, 8,000+ cycle life, integrated PCS and BMS, and UL 9540A-tested enclosures. A 10 MW / 20 MWh project built on four 5 MWh-class containers fits the same utility-scale platform the 100 MW projects use, which keeps spare parts, service procedures, and warranty terms consistent across a fleet. Whatever vendor you choose, the checklist is the same: match the test report to the exact configuration on your quote, and get documentation discipline in writing — it predicts everything else about the supplier relationship.
The economics of a 10 MW California battery storage project
Here is where the case study either closes or dies, and where the mid-size segment diverges from the 250 MW headlines. The revenue stack has three layers:
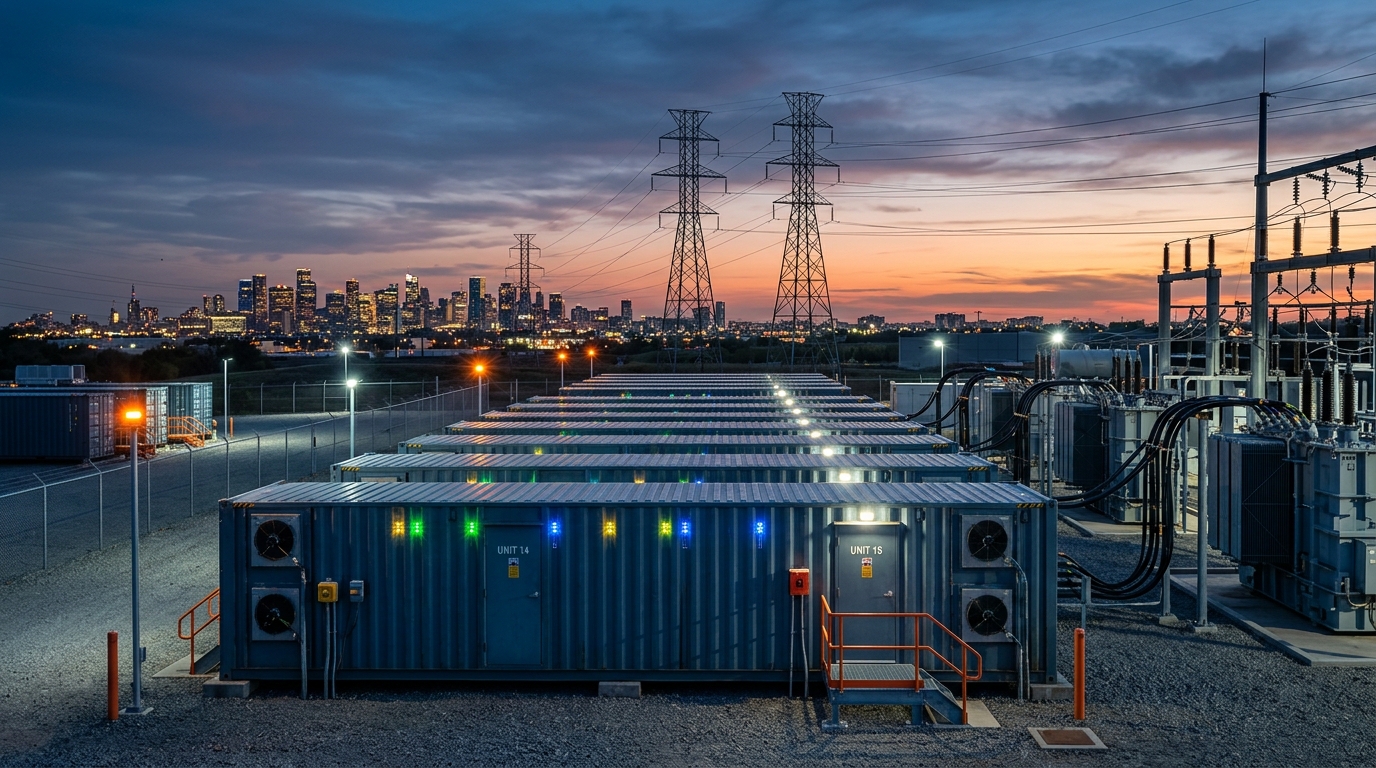
The evening dispatch window — batteries discharging into the grid as solar fades and peak demand arrives.
Energy arbitrage. The core business: buy at the midday solar trough, sell into the evening ramp. CAISO day-ahead and real-time prices in California exhibit a persistent daily spread because of the solar duck curve — this is the same structural signal that justifies the whole fleet, and it works at 10 MW as well as 250 MW.
Grid services and capacity. A fast-responding 10 MW plant can participate in CAISO ancillary services — regulation and contingency reserves — where response time, not size, is what gets paid. A four-hour duration variant additionally becomes eligible for resource adequacy capacity payments, which is why the 2-hour vs 4-hour decision is an economics decision: 4-hour systems cost more per MWh of energy but unlock a capacity revenue stream that banks underwrite.
Behind-the-meter optionality. If the site is behind the meter, demand-charge reduction on a commercial tariff can be the most predictable layer of the stack — shaving the facility's own peak while still capturing arbitrage where the tariff allows.
On the cost side, the honest statement is that a 10 MW project's capital cost per MWh depends on timing, configuration, and vendor — and the industry-wide trajectory is firmly down (about 93% since 2010, per the CEC's IRENA citation). Rather than print a capital-cost number that will be stale by publication, build the model with your supplier's current quote, then apply the up-to-30% ITC and stress-test two assumptions: the arbitrage spread and the interconnection schedule. The arithmetic in this article is deliberately illustrative — replace the inputs with current quotes before you present the model anywhere.
What the market data anchors look like. Two pieces of dated public data let you sanity-check the model before any vendor quote arrives. In August 2025, CAISO's grid-scale batteries earned about \$2.5 per kW-month from energy arbitrage and ancillary services — roughly \$300,000 a year for a 10 MW plant, gross of operating and financing costs. A year earlier the same fleet averaged \$4.14 per kW-month; day-ahead price spreads had tightened by about 40% as more storage came online. That decline is the arbitrage-spread risk you are stress-testing, in real numbers. The incentive side of the same table is the federal credit plus, where eligibility applies, SGIP:
Line item | 2-hour (10 MW / 20 MWh) | 4-hour (10 MW / 40 MWh) |
|---|---|---|
CAISO merchant revenue anchor (Aug 2025, fleet average, arbitrage + ancillary) | ≈ \$2.5/kW-month → ≈ \$300,000/yr gross at 10 MW | Same \$/kW; the longer window and resource-adequacy capacity payments change the revenue mix |
Federal ITC, standalone storage (full rate) | Up to 30% of qualified costs (6% base) | Same rate — the credit scales with project size |
SGIP large-scale storage rate (through 2025; narrow eligibility at this scale) | \$250/kWh → \$5.0M at 20 MWh | \$250/kWh → \$10M at 40 MWh |
Energy capacity (capacity/power ratio) | 20 MWh (two-hour) | 40 MWh (four-hour) — the RA-eligible variant |
Illustrative arithmetic: dated public data and representative assumptions — not a quote for any specific project, and no customer or investment figures are invented. Replace the revenue and rate inputs with current market data and vendor quotes before presenting the model.
The shape of the math is what matters: apply the up-to-30% ITC to your quoted capital cost (a quote of \$X leaves roughly 0.7 × X net of the credit), anchor revenue to current CAISO merchant data rather than last year's, and let the 2-hour versus 4-hour choice fall out of the capacity-revenue line.
Four lessons from the mid-size segment (and the mistakes to skip)
Every publicly documented California storage failure or delay — the permitting fights, the queue misses, the equipment mismatches — traces back to one of four lessons:
- Interconnection timing is the project, not a step in it. Start the application before you select equipment, and hold land options long enough to survive the queue. At 10 MW, a 24-month interconnection delay is a business-model event, not a schedule slip.
- Compliance documentation is a siting decision. The UL 9540A report and NFPA 855 separation tables determine whether the project fits the parcel at all. Bring the fire marshal into the layout conversation early — SB 283 now requires it anyway.
- Revenue needs two legs at minimum. Arbitrage alone is thin for a bank. Stack grid services or RA capacity (which favors 4-hour duration) or behind-the-meter demand-charge value, and model the stack before committing to a duration.
- Supplier selection is documentation discipline. The vendor whose test reports, datasheets, and warranty terms survive a checklist is the vendor whose factory will reproduce the tested unit. Slow or incomplete documentation at RFQ predicts every downstream process problem.
There are also honest warnings the promotional pages skip: mid-size projects pay more per MW for interconnection studies than large ones, community opposition can add a year to permitting even with a clean safety record, and single-revenue models fail. None of these are disqualifying — they are the known risks you price into the plan. When you reach procurement, our C&I BESS procurement guide covers the RFQ and vendor-scorecard side of the same process.
Start now: a 24-month path from site to COD
A realistic schedule for a 10 MW California project, with the steps from this case study in order:
Month | Milestone |
|---|---|
0-3 | Site control, interconnection application filed, permit application drafted |
3-12 | Interconnection studies run; conditional-use permit and CEQA review proceed; fire authority engagement (SB 283) |
12-18 | Interconnection agreement; equipment order placed; ITC and financing structure locked |
18-24 | Equipment delivery, installation, commissioning, testing, COD |
The two variables that move the plan are the interconnection queue and the permit calendar — start both on day one, and the rest of the schedule follows.
If you are evaluating a 10 MW (or larger) project and need the equipment side answered — configuration, certifications, delivery timeline — brief our engineering team with your application, capacity, and target market. An application engineer, not a salesperson, comes back within one business day with a system configuration and the test documentation attached. The grid operator sets the schedule; the rest of the path is yours to plan.