

Why Indiana's storage story skips the 19.2 MW projects
Indiana's battery storage coverage is a list of things that have not been built yet. Six hundred megawatts at Dumont–Greentown in Marshall County. A substation-scale proposal in Huntington County listed at 689 MW. A 200 MW / 800 MWh development that the Hamilton County zoning board rejected unanimously after more than thirty residents spoke against it. A $3.5 billion cell factory in New Carlisle that has been re-planned around storage demand before it ships a commercial cell.
Those are real projects and real money. The pipeline they sit in is tracked in detail on Cleanview's Indiana battery storage map. For anyone actually trying to put a battery in the ground in this state, they are also the least useful part of the story — because they describe capacity in a filing, not capacity in service.
The projects that get sited, permitted, energised and paid are usually an order of magnitude smaller. Ten to twenty-five megawatts. Connected at a distribution or sub-transmission substation rather than a 765 kV line. Sited on a few acres next to an existing utility asset, not on a greenfield parcel that needs its own switchyard.
The Indiana battery storage project this case study follows is one of those mid-size builds: a delivered 19.2 MW / 46.9 MWh system. Its headline numbers are worth reading closely for a simple reason — nothing that looks like them appears in the results that English-language searches on the topic return.
That is not a complaint about journalism. It is a structural gap. A capacity announcement is public the day it is filed. The operational record of a 19.2 MW asset is visible only to the people who own, operate or procure it. This article publishes what can be published, and says plainly what cannot.
Inside the Indiana battery storage project: 19.2 MW AC / 46.9 MWh
Parameter | Value |
|---|---|
Rated AC power | 19.2 MW |
Energy capacity | 46.9 MWh |
Duration at rated power | ≈2.44 hours |
Chemistry | Lithium iron phosphate (LFP) — manufacturer's standard format |
Location | Indiana, United States |
Status | Delivered; part of the manufacturer's reference project portfolio |
Client identity, site and point of interconnection | Not disclosed |
Capital cost and commercial terms | Not disclosed |
Equipment bill of materials | Not disclosed |
The undisclosed rows carry as much weight as the published ones. Client names, exact points of interconnection and cost breakdowns are commercially sensitive on almost every utility-scale and large C&I asset, and a case study that invents them is worth nothing to the reader who has to defend a budget. What can be reconstructed honestly is the decision chain — and that is where the transferable value sits.
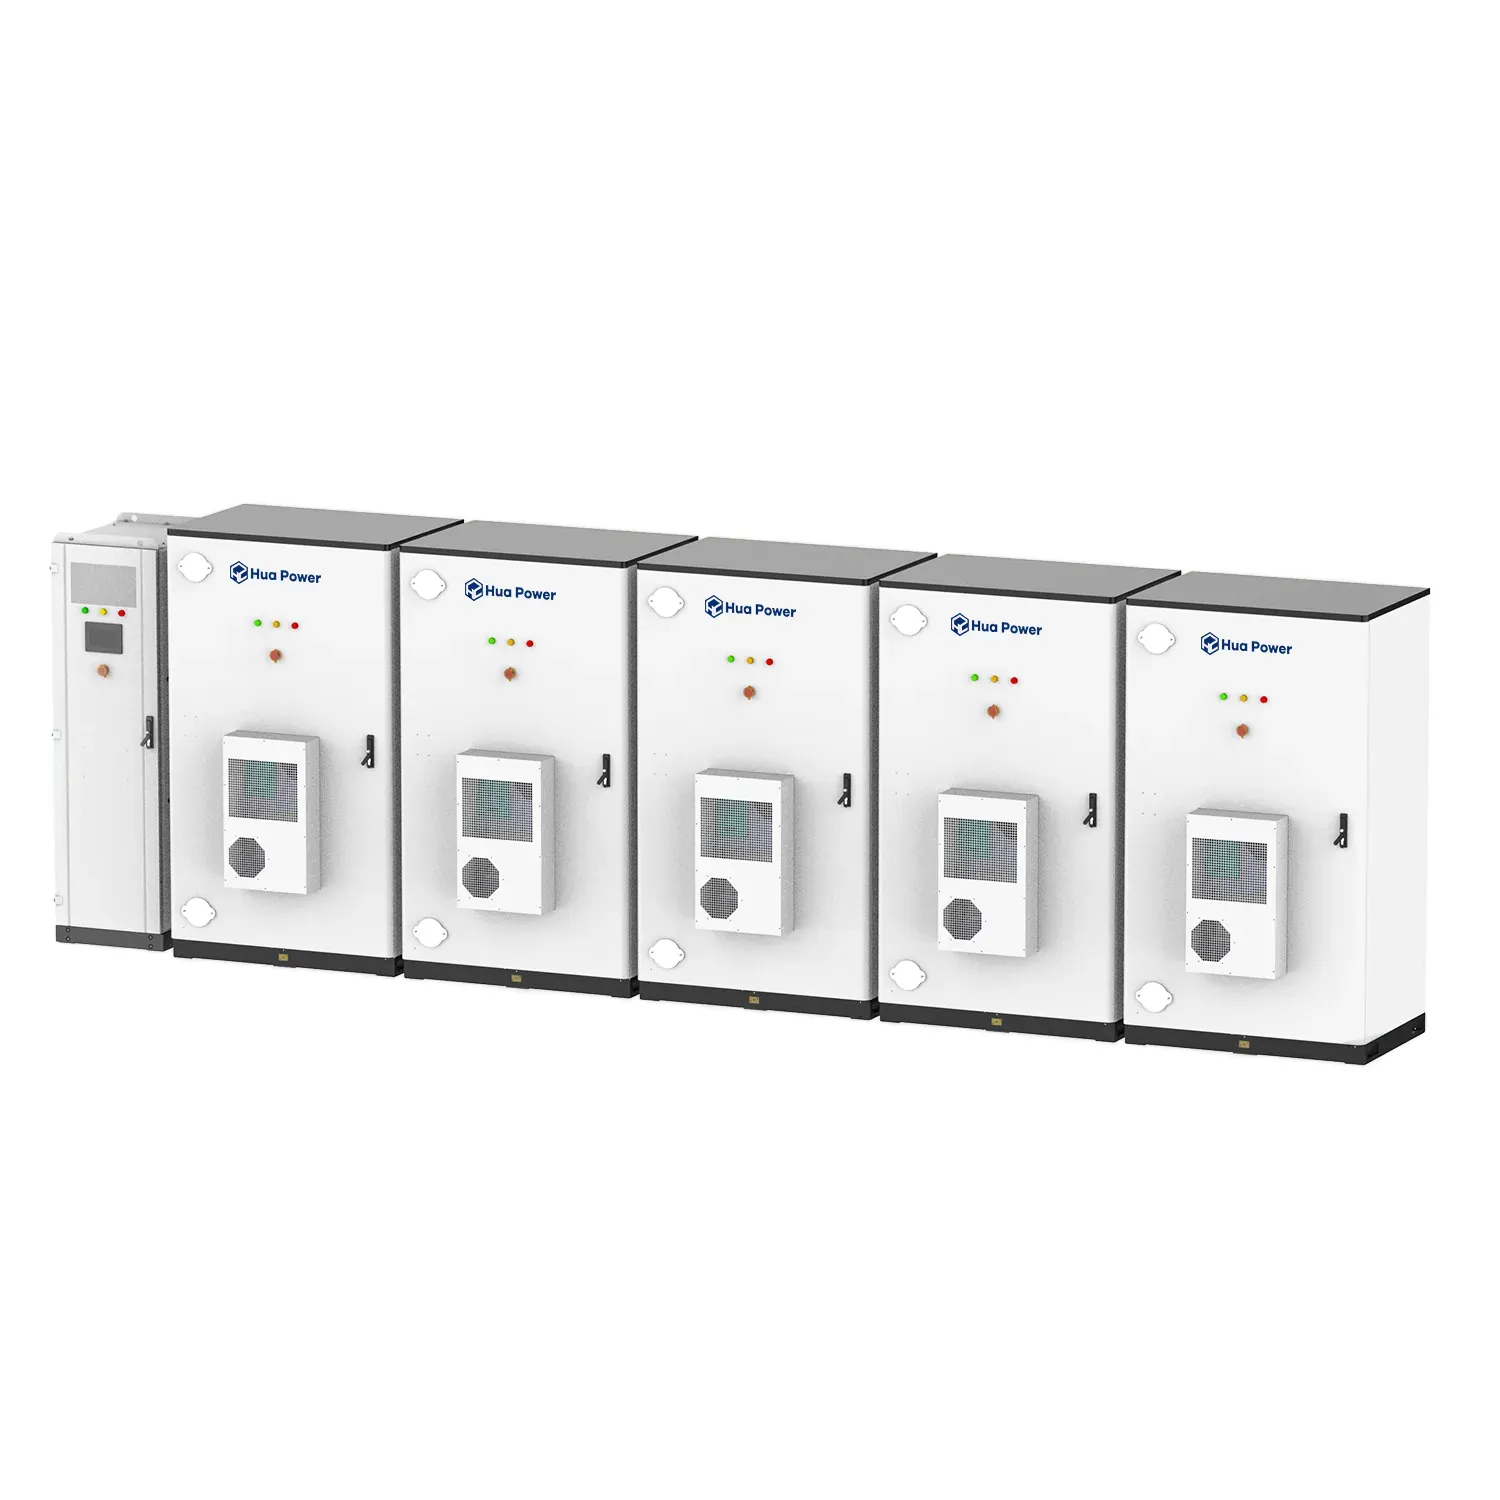
A build this size is unitised storage like this — self-contained units, plus a transformer and switchgear — rather than one monolithic machine.
Why 2.4 hours, not 2 and not 4
Divide 46.9 MWh by 19.2 MW and you get 2.44 hours. That is not a round number, which tells you it was not chosen as a specification. It fell out of two constraints that moved independently.
Power was set first, by the interconnection. The 19.2 MW figure is the size of asset the host site and its utility could reasonably accommodate at the point of connection available to it. In projects of this class, the AC rating is negotiated against existing transformer capacity and the local circuit's hosting capacity — not against an ideal system size.
Energy was set second, by the revenue window. Once power is fixed, megawatt-hours are bought to cover a duration. A two-hour system (19.2 MW / 38.4 MWh) captures the highest-value hours but leaves nothing for a longer evening ramp or a second daily cycle. A four-hour system (19.2 MW / 76.8 MWh) adds capital cost for energy that many Indiana revenue stacks cannot pay back. At 2.44 hours, the project sits in the band where the additional MWh still earns its keep.
That middle position has a cost you should model before copying it: cost per MWh, not cost per MW, is what decides whether a mid-duration asset pays. How storage cost per MWh is actually calculated walks through the levelised-cost mechanics, and duration sensitivity is the single largest lever in that model.
Duration also decides how many distinct services one asset can serve. A 2.44-hour system can stack bulk energy shifting with a capacity-style commitment. It cannot credibly promise four-hour firm output, and any contract that assumes it can is a construction dispute waiting to happen.
The rule that travels: in this size band, power is negotiated with the utility and energy is bought by the revenue stack. Buy the megawatt-hours last, and buy them against a dispatch model you can defend.
Interconnection: Indiana sits in two markets
Most state-level storage writing treats "the grid" as one thing. Indiana's is not. The state is split between two regional transmission organisations, and which one your project sits in changes the queue you join, the study process you pay for, and the revenue products available at the end of it.
That split has a capacity dimension. MISO's regional resource assessment projected a 6 GW capacity shortfall in Local Resource Zone 6 — the zone covering Indiana and parts of Kentucky — as reported by Energy-Storage.news, alongside a separate industry finding that MISO needs roughly a 500% increase in storage deployment by 2035 to close the gap. Retirement schedules drive that number: as coal and older gas units in the zone come off line, something has to hold the capacity. Demand is moving the other way at the same time — the same report on Indiana's re-planned cell factory counts the load growth from AI data centres, which need large amounts of highly reliable power, as another source of demand for batteries — a second driver for storage in the zone on top of the retirement schedule.
Two consequences matter for a project in this size band.
Interconnection study time is the schedule. In a zone with an active queue, the study is frequently the longest single item on the critical path — longer than procurement and longer than construction. Owners who fix a commercial operation date before the study result lands are guessing.
The state's generation mix is the backdrop. Indiana's net summer capacity was 27,837 MW in 2024 and coal remained its primary energy source, according to the U.S. Energy Information Administration's Indiana profile. A system that shifts energy out of the evening ramp inherits value directly from that mix, and that value will move as the mix changes.
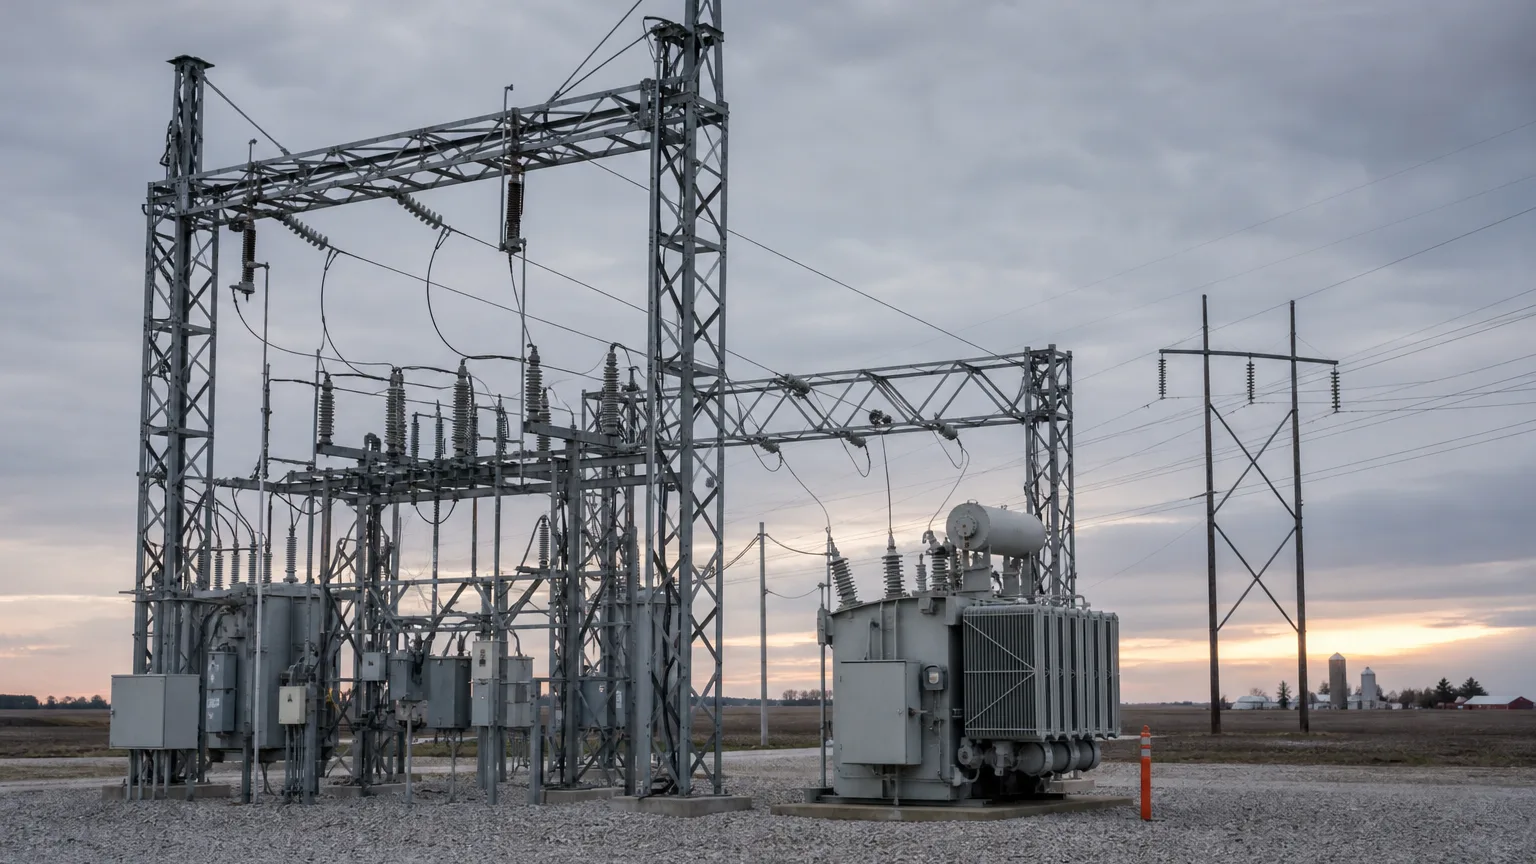
A mid-size project connects at this layer: an existing substation and its spare capacity decide the AC rating long before the equipment list does.
The compliance stack Indiana actually enforces
This is where mid-size projects most often under-plan. The equipment standard, the installation standard and the state permit requirement are three different documents from three different authorities, and passing one does not satisfy the others.
The three layers, in the order they hit a schedule:
- Cells and modules. IEC 62619 covers industrial lithium cells and batteries; UL 1973 is its North American counterpart for stationary battery systems. Both are product-level documents. Neither tells a fire official anything about your site.
- System-level fire behaviour. UL 9540A is the test method for evaluating thermal runaway fire propagation in battery energy storage systems, and it is the only consensus standard explicitly cited in NFPA 855 for large-scale fire testing. Its cell-, module-, unit- and installation-level tests produce the gas, heat-release and deflagration data that the installation codes depend on.
- Installation and permitting. NFPA 855 is the installation standard for stationary energy storage: separation distances, hazard mitigation and, in recent editions, updated guidance on large-scale fire testing. In Indiana, projects in this class are typically required to obtain multiple permits through the Indiana Department of Homeland Security, with fire-safety review and on-site response training as part of the package.
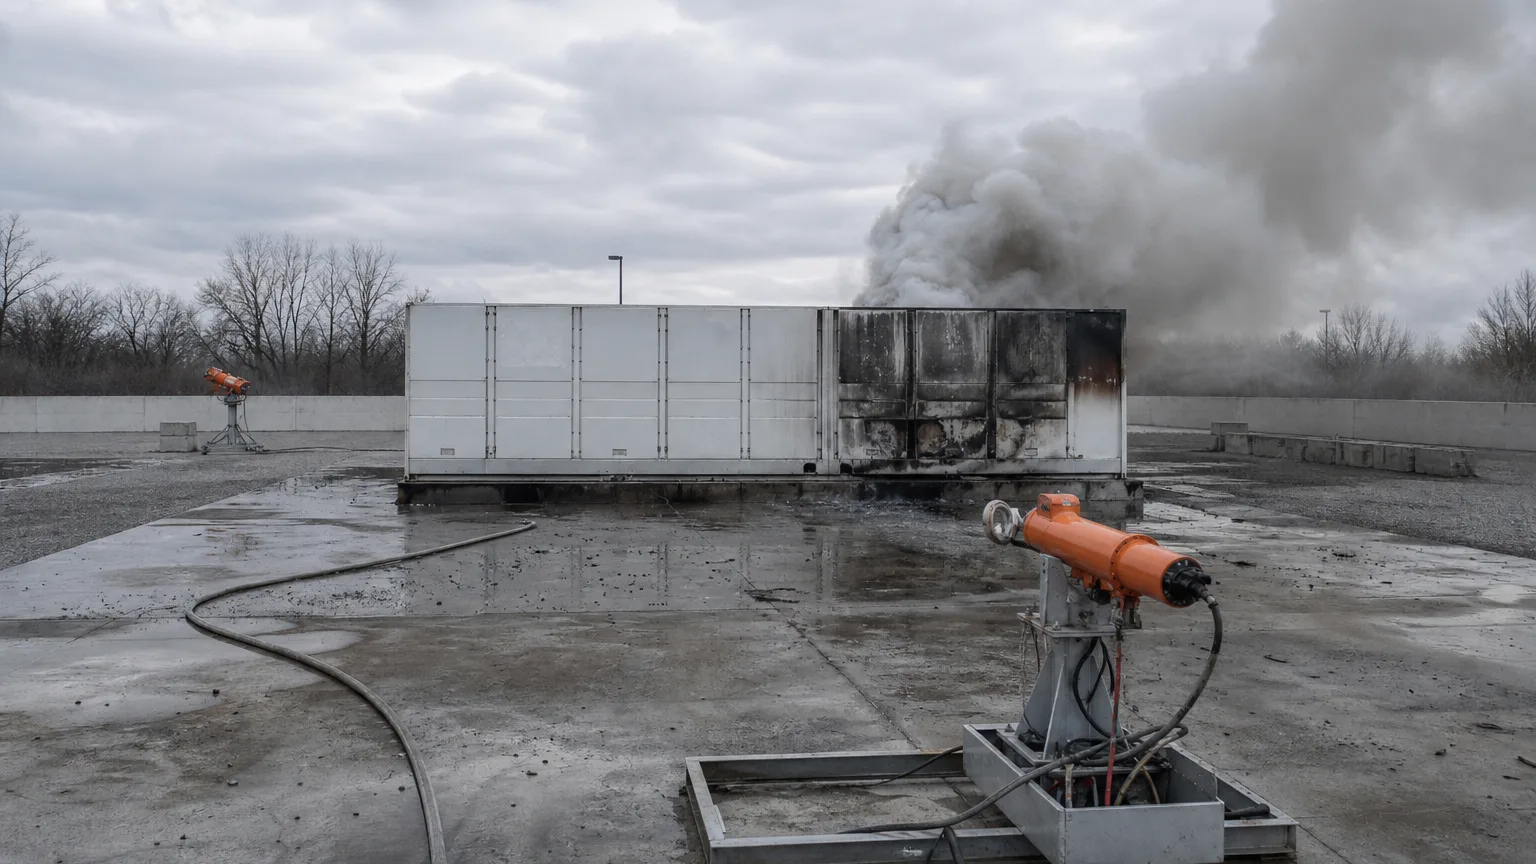
A large-scale fire test is an experiment, not a certificate: the enclosure, the spacing and the suppression design are what the results apply to.
The trap is treating a supplier's UL 9540A report as a site approval. A test result is valid only for the configuration that was tested. Change the unit spacing, stack the cabinets differently, or install indoors where the report covers outdoor units, and the basis for the fire official's approval no longer matches the site in front of them. The transferable rule: buy the report with the configuration, not before it. What a UL 9540A-tested cabinet actually proves covers how to read one.
County-level risk is now the real schedule driver
The engineering on a 19.2 MW project is rarely what kills it. The zoning hearing is.
The clearest recent Indiana example is the Kingfisher Reserve proposal in Hamilton County — 200 MW / 800 MWh, on 9 acres of a 70-acre parcel roughly 3.9 miles northeast of Noblesville. The developer had filed an interconnection request with MISO, completed environmental and engineering due diligence, and started safety training with county emergency management. The zoning board rejected it unanimously anyway, after a presentation built around fire safety and comparisons to the Moss Landing fire in California, where cleanup and an EPA agreement with the site's owner were still underway.
Two lessons transfer directly to a 19.2 MW project, which will be reviewed by the same kind of board.
Bring the fire data, not the brochure. Presenting chemistry, separation distances and what the UL 9540A test actually demonstrated is a different conversation from presenting a project narrative. Officials faced with a proposal of this size ask about deflagration and re-ignition, not about capacity.
Engage the fire department before the first hearing. The response plan, the site access and the training are deliverables the county expects to see. Producing them after a rejection is a re-application, not a fix.
A third lesson is less comfortable: public opposition is not a fringe phenomenon in Indiana, and organised objection to storage on agricultural land has surfaced in more than one county. Site selection that puts the asset behind an existing substation on industrial or utility land is worth more than a marginal improvement in projected revenue.
What a 19.2 MW build actually ships with
A project at this scale draws on a specific equipment family. Its boundaries are decided by three questions: cabinet or container, air-cooled or liquid-cooled, and DC-only block or AC-coupled unit.
The short version of the current market for this size band, using Hua Power's lineup as the reference:
Format | Typical rating | Where it fits | Example |
|---|---|---|---|
Containerised AC block | 1 MW / ~2.1 MWh per 20-ft unit | Larger pads, minimal site works, single-vendor scope | HC-UPSA2089L: 1 MW / 2.089 MWh, 400 V 3P3W, liquid-cooled, off-grid transfer under 20 ms, ≥85% round-trip efficiency, ≥8,000 cycles at 80% SOH, IP54 / C4 |
Containerised DC block | ~5 MWh per 20-ft unit | Buyers who source PCS separately or want more energy per enclosure | HC-UPSB5010L: 5,015.96 kWh liquid-cooled, 0.5C or 0.25C, ≥87% round-trip efficiency, IP54 / C4, −30 to 50 °C, UL 1973, UL 9540A, UL 9540 and UN38.3, stated as compliant with NFPA 855, NEC 2023 and NFPA 70E |
Split cabinet | 400 kW / ~965 kWh per system | Clustered expansion and sites with tight access | HC-UPSSP964: 400 kW / 964.60 kWh across four clusters, 400 V 3P4L+PE |
AC-coupled cabinet | 125 kW / ~241 kWh | Smaller nodes placed along a circuit | HC-UPSA241: 125 kW / 241.152 kWh, 230/400 V in 3P3L or 3P4L+PE, 768 V nominal, PCS efficiency up to 98.5%, IP54 / C3-M |
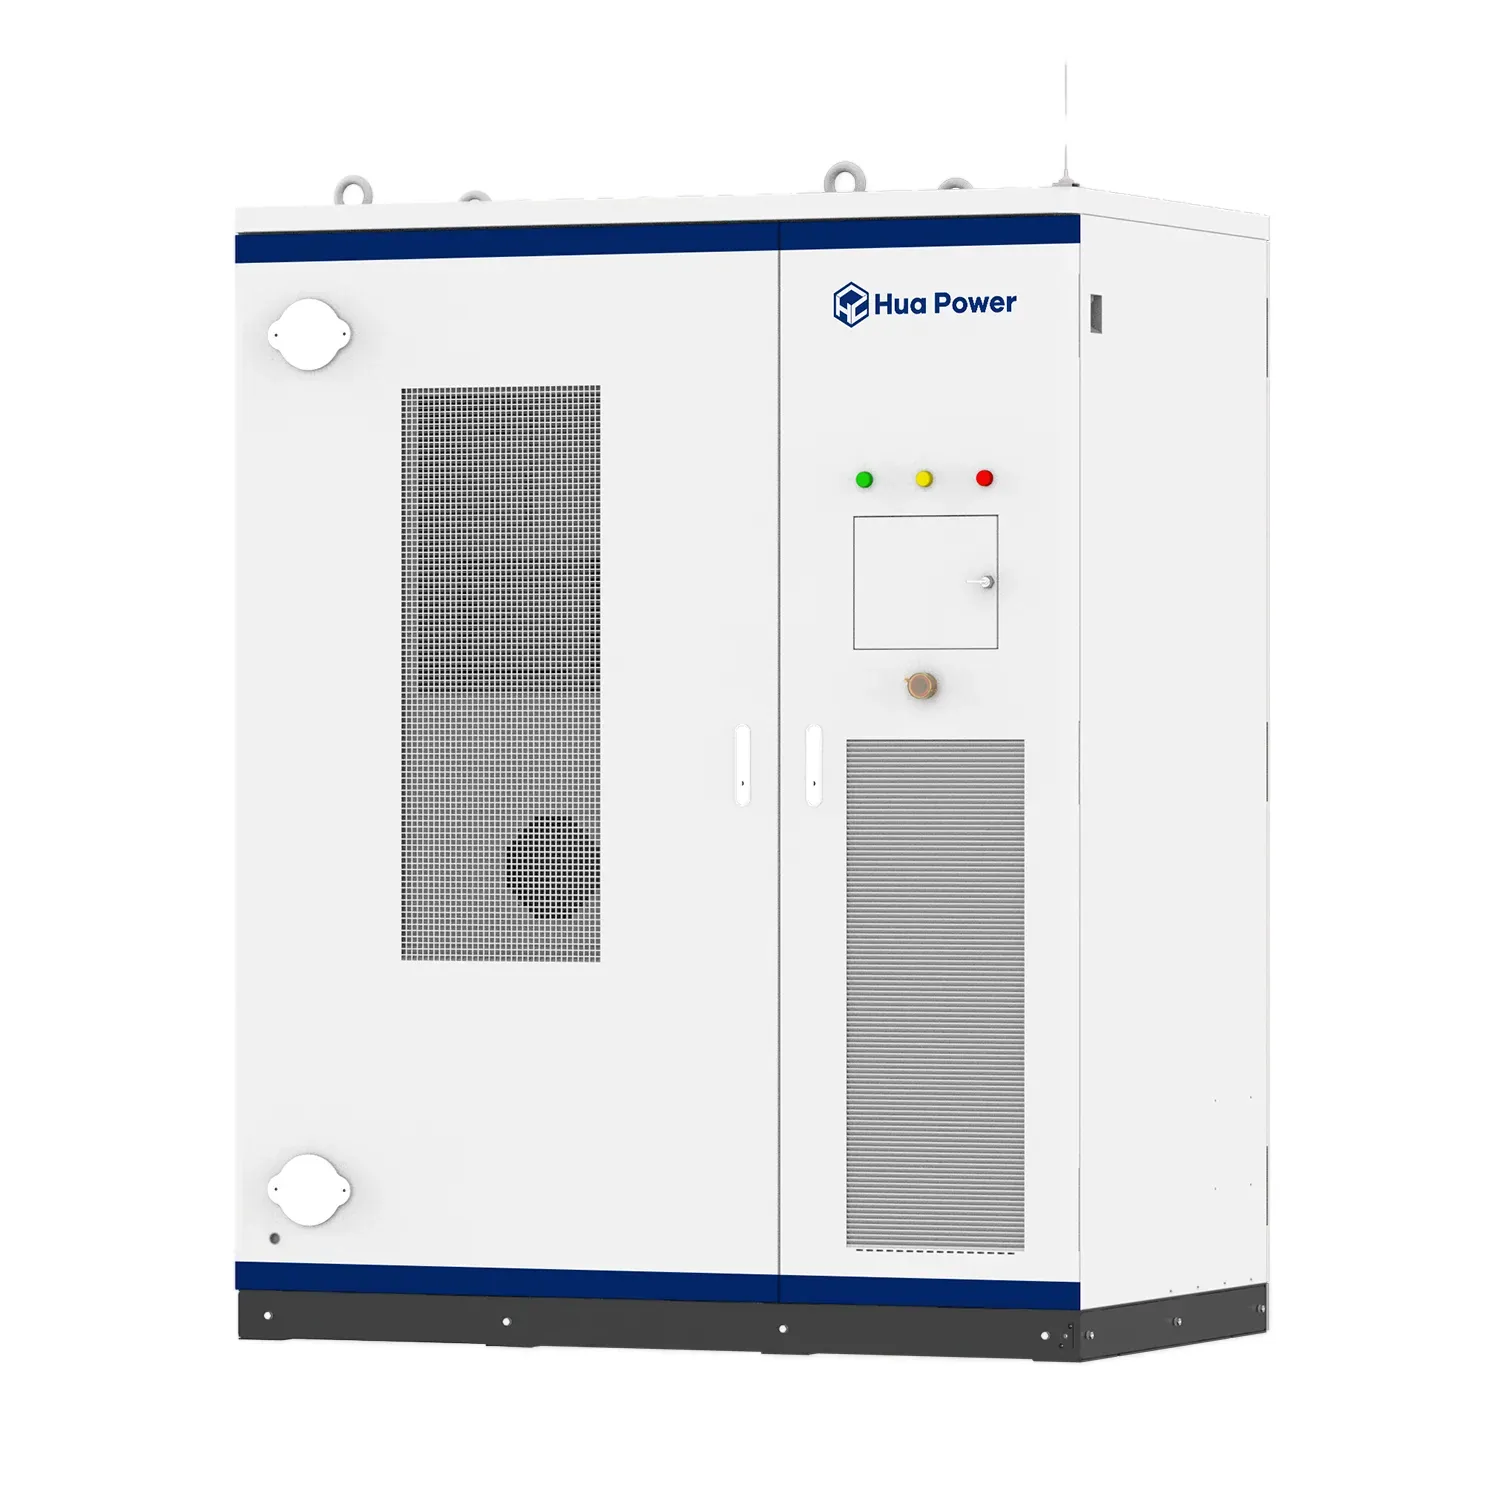
The AC-coupled format from the table above: an outdoor cabinet sized to sit along a circuit as a smaller node, not at its centre.
Two selection rules hold regardless of brand.
For a 19.2 MW site, DC blocks plus a separate central PCS usually win on footprint and energy density; containerised AC blocks win on installation time and engineering scope. That trade decides cost more than cell price does, because it moves labour from the site to the factory.
Above roughly 500 kWh per enclosure, liquid cooling stops being a premium option and becomes a control requirement. It holds cell temperature spread tight enough to support the cycle-life figure the warranty is priced on, and it preserves full-power output at ambient temperatures that would force air-cooled units to derate. The trade-offs are laid out in liquid-cooled versus air-cooled cabinets, and the 5 MWh-class container format is documented on the HC-UPSB5010L product page.
Dispatch lives one layer above the hardware. At this scale the energy management system is what turns a storage asset into a market participant, because it is where the schedule, the state-of-charge limits and the site's own load profile are reconciled. Hua Power's platform is branded Visual Energy.
Commissioning and the first year of operation
The published record of storage projects stops almost entirely at commercial operation, which is unfortunate, because the first year is where the assumptions get tested.
Four measurement areas decide whether a 2.44-hour asset performs as modelled.
Round-trip efficiency under real dispatch. Nameplate figures in this class run around 85–87%. What matters in operation is the figure at your actual cycling pattern, including auxiliary load from cooling and the transformer.
Availability and unplanned outage hours. A capacity-style commitment is worth only what the availability record supports. Track outage reasons, not just totals — most first-year availability losses trace to a small number of balance-of-plant faults rather than to the batteries themselves.
State-of-charge discipline. Running to the extremes to chase one high-value window costs cycle life. The operating envelope, not the warranty document, decides whether the ≥8,000-cycle figure at 80% state of health is reachable.
Degradation against the augmentation plan. A 2.44-hour asset typically starts planning augmentation earlier than a two-hour asset used for the same services, because energy capacity is what falls away first.
Site-level programmes add a second revenue axis to the same asset. Demand response programmes that a site like this can serve are worth modelling alongside wholesale revenue, particularly where the host already carries a demand charge.
Five things to get right on a build this size
A case study that reports only what went well is marketing. Five items are worth carrying into the next one.
- Resolve the fire-review configuration before the purchase order. Fixing unit spacing, enclosure type and suppression design after the order means re-testing or re-arguing the report at the worst possible moment.
- Start the county conversation six to nine months before the hearing. The Kingfisher Reserve record is the argument: a complete technical package did not save an application once the board was already hearing from opponents.
- Treat interconnection study time as the schedule baseline. Everything downstream — procurement, civil works, commissioning — can be compressed. The study cannot be compressed by the applicant.
- Buy duration for the second cycle, not the first peak. The choice between 2 and 2.5 hours is a revenue-stack question, and it should be answered with the site's own load and tariff data rather than a rule of thumb.
- Instrument dispatch data from day one. First-year efficiency, availability and degradation curves are what make the next project's model credible — and what make an augmentation plan defensible to a lender.
If you are sizing a project in this band, or deciding whether a site can carry one, our U.S. market and compliance hub collects the state-by-state and standards-side context, and the 10 MW California case study follows this format for a different market. For a sizing review against your own interconnection position, talk to our engineering team.