

Open a supplier's quote sheet and you will find the two numbers on different lines, in different sections, sometimes on different pages. A C-rate of 0.5C under "power". A depth of discharge of 90% under "battery parameters". Eight thousand cycles under "warranty". Each one is true. None of them is usable on its own, and the sentence the three of them are trying to say is one nobody wrote down: this is a 1.8-hour machine, and it stops being a 1.8-hour machine somewhere around year eight.
That gap is where projects get into arguments. Not over whether a supplier lied — usually nobody did — but over a number that was quoted at one condition, warranted at another, and measured at commissioning under a third.
The definitions of C-rate and depth of discharge are covered properly elsewhere: the knowledge base entry on C-rate for what the letter means and how it is calculated, and the entry on depth of discharge for the capacity window it describes. This page assumes both and takes the next step, which is the one that costs money: how a C-rate and a DoD claim behave in a real project, how the pair sets the nameplate you have to buy, what a cycle count is actually promising, and how to prove the pair at commissioning rather than assume it.
C-rate and DoD are one number pair
A battery has two ratings that look independent and are not. The C-rate says how fast energy can leave. Depth of discharge says how much of the stored energy is allowed to leave before the system stops. Multiply them against capacity and you get the only two numbers a project actually feels: power in kW, and duration in hours.
usable energy (DC) = nameplate capacity × DoDpower at the rated C-rate = nameplate capacity × C-rateduration at rated power = DoD ÷ C-rate
That third line is the one worth memorising, because it has no capacity term in it at all. Duration is a property of the pair, not of the size of the box. A 0.5C rating at 90% DoD is 1.8 hours, whether the cabinet is 100 kWh or 5 MWh. A 0.25C rating at 100% DoD is four hours. Same chemistry, same cells, completely different product.
C-rate | DoD | Duration at rated power | What it looks like on a datasheet |
|---|---|---|---|
0.25C | 100% | 4.0 h | A long-duration block, sized for energy |
0.33C | 90% | 2.7 h | Above the two-hour line; usually oversize for the job |
0.5C | 100% | 2.0 h | The textbook two-hour system |
0.5C | 90% | 1.8 h | The same hardware, sold as a two-hour system |
1C | 90% | 0.9 h | A power product, one hour or less |
Read the fourth and fifth rows again. Those are the same cells and often the same cabinet, and the difference between them is a DoD setting in the BMS plus the sentence in the warranty. A procurement that specifies "two-hour system, 0.5C" and accepts a 90% DoD has bought 1.8 hours. That is a 10% shortfall against a power obligation, discovered at the worst possible moment — during a demand-response event or a capacity test, not in the contract review.
The guide to choosing between 0.25C, 0.5C and 1C covers which rate to buy and what it costs in cooling and cycle life. This page is about the other half: once you own a rate, what the DoD next to it commits you to.
What the pair costs you in nameplate
Sizing is where the pair stops being vocabulary and becomes capital. The requirement that matters is almost never "a 1 MWh battery". It is energy delivered at the AC terminals, on the last day of the warranty, through the usable window, above the contractual retention floor. Four divisors, and the DoD is one of them.
required nameplate (DC) ≥ required AC energy ÷ round-trip efficiency ÷ (retention floor × usable DoD window)
Take a requirement of 1,000 kWh at the AC terminals in year ten, with a retention floor of 80%, a system round-trip efficiency of 85%, and — this is the variable in question — a 90% DoD window:
1,000 ÷ 0.85 ÷ (0.80 × 0.90) ≈ 1,634 kWh
Change only the DoD and the nameplate you have to buy moves by more than a third:
DoD window | Nameplate needed for 1,000 kWh AC at year 10 | Change vs 90% DoD |
|---|---|---|
100% | 1,471 kWh | −10% |
90% | 1,634 kWh | — |
80% | 1,838 kWh | +13% |
70% | 2,101 kWh | +29% |
60% | 2,451 kWh | +50% |
The assumptions are illustrative and linear; the direction is not. A supplier who quotes a generous DoD is selling you a smaller box for the same requirement, and a supplier who quotes a conservative one is selling you a bigger box and calling it margin. Neither is lying. But a bid comparison that holds nameplate constant while DoD differs is not comparing the same asset, and it is the most common way an apples-to-apples table turns into an apples-to-oranges one. In money it is close to linear too: each additional point of DoD headroom costs between roughly 1% and 1.7% more nameplate for the same delivered kWh, and the cost climbs as the window narrows. That is the only place this pair shows up on a budget line.
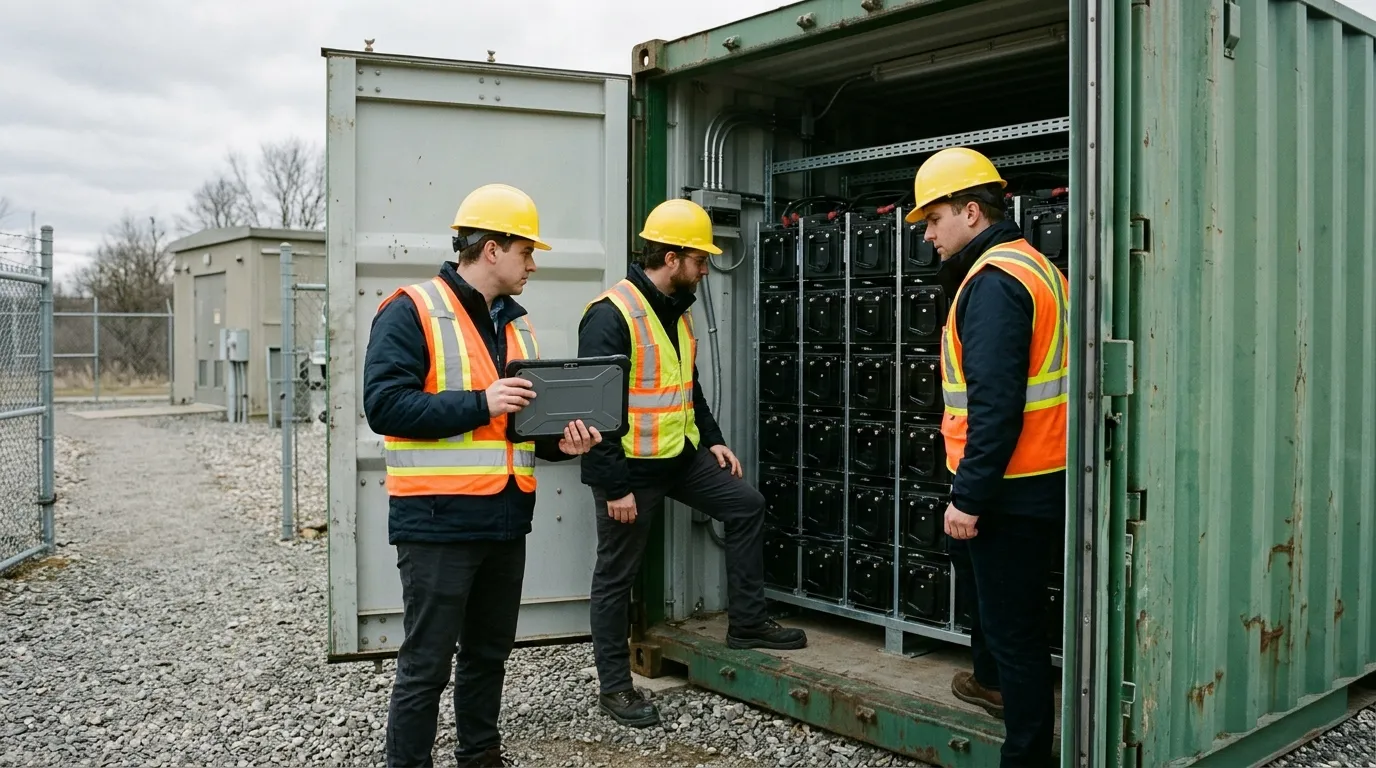
The power side degrades in parallel, which is the part that gets missed. C-rate is defined against nameplate capacity, so a pack at 85% state of health cannot deliver the same kW at the same C-rate as it could on day one — the current that was 0.5C is now 0.5C of a smaller number. Add temperature derating and the pair erodes on both axes at once: the usable kWh shrinks with fade, and the kW shrinks with fade and with ambient heat. That is also why the arithmetic above divides by the window rather than subtracting a reserve from it: a 10% reserve taken off the top of a 100% window is not the same asset as a 90% window applied to a pack that has already lost 15%.
The warranty argument a cycle count is making
"8,000 cycles" is not a lifespan statement. It is a statement about a test, and the two variables that define the test are the DoD it was run to and the C-rate it was run at. Strip those out and the number is unfalsifiable.
Two clauses convert it back into something you can hold a supplier to. The first is the retention schedule: how much capacity remains at year five and year ten, measured how. The second is the throughput cap, usually expressed in MWh moved through the asset over the term. That one is the most useful number on the sheet, because dividing it by nameplate gives you the equivalent full cycles the supplier actually expects you to run:
equivalent full cycles allowed = throughput cap (MWh) ÷ nameplate (MWh)
Compare that with your own duty cycle — 330 equivalent full cycles a year for a daily-cycled solar asset, roughly 700 for a two-cycle commercial profile — and the warranty's real horizon appears. A cycle count of 8,000 delivered at 90% DoD is about 7,200 equivalent full cycles of throughput; the same 8,000 at 60% DoD is 4,800. The headline went up, the energy moved went down. That is not a trick, it is what shallow cycling does, and it is why a cycle count and a DoD have to be read as a pair or not at all.
Which is the honest way to read the industry's favourite shorthand. The pages that rank for this pair mostly say one thing — keep depth of discharge at or under 80% — and it is not wrong: shallow cycling does return more cycles, as the 8,000-to-7,200 conversion above shows. What it leaves out is everything that number needs in order to mean anything: the C-rate it was cycled at, the cell temperature, the retention floor it was measured to. Stated on its own, 80% is a DoD without its partner — a reasonable starting point, not a specification.
The depth of that trade is measurable. In a controlled study cycling LiFePO4/graphite cells across different operating windows, shifting the window changed the fade rate by 250% to 400%, with average state of charge the most influential variable ahead of temperature (Journal of The Electrochemical Society). The practical implication for a designer is that the DoD choice is not a comfort setting on the BMS — it is a multiplier on the whole life forecast, in the same league as cell temperature — and that where the window sits in the state-of-charge range matters at least as much as how deep it is.
Which means the optimisation is joint, not sequential. Pushing DoD higher buys nameplate efficiency at the cost of cycles. Pulling it lower buys life at the cost of steel, floor space and interconnection capacity. Neither answer is correct in the abstract; the knowledge base entry on battery storage warranty is the right place to see how the clause shapes differ, and the arithmetic above is how you price them against each other.
Commissioning: the same battery, two test results
Here is the uncomfortable fact about capacity tests: the rate you discharge at changes the number you get. Pull energy out faster and less of it comes out, because internal resistance eats a larger share of the terminal voltage and the cut-off arrives sooner.
A published rate sweep on cylindrical lithium-ion cells makes the size of the effect visible: across discharge rates from 1C to 11C, the proportion of rated capacity actually delivered fell from 86.45% to 78.42% (Energies 17(14):3488). Those are ternary cells, not LFP, so the magnitude does not transfer — but the direction does, and it is why a commissioning test run at 1C and a warranty claim measured at 0.5C can disagree about the same pack without either party being wrong.
So the test has to be defined before it is run, and the definition has to name four things:
- The discharge rate, matching the one the warranty names. A 0.5C warranty tested at 1C is a different test with a predictably worse result.
- The cut-off, expressed against measured capacity rather than nameplate. If DoD is defined as a percentage of nameplate and the pack has already faded, a "90% DoD" test is not discharging 90% of what is there.
- The temperature band, held inside the warranty envelope with cell-level temperatures logged, not one cabinet average.
- The energy integration method — DC energy accumulated over the discharge, per cluster as well as at the system total, so a weak string is visible rather than averaged away.
This is not an eccentric house standard. IEC 62933-2-1, the general specification for electrical energy storage unit parameters and test methods, treats energy capacity as something defined at the point of connection and evaluated together with the power rating and the losses around it (IEC 62933-2-1:2017); the standard's own definition of nominal energy capacity is the rated output power multiplied by the output duration at that power (clause 5.2.1). A capacity figure that arrives without a power attached to it cannot be checked against that definition, which is exactly why the pair has to be pinned in the test procedure and not only in the datasheet.
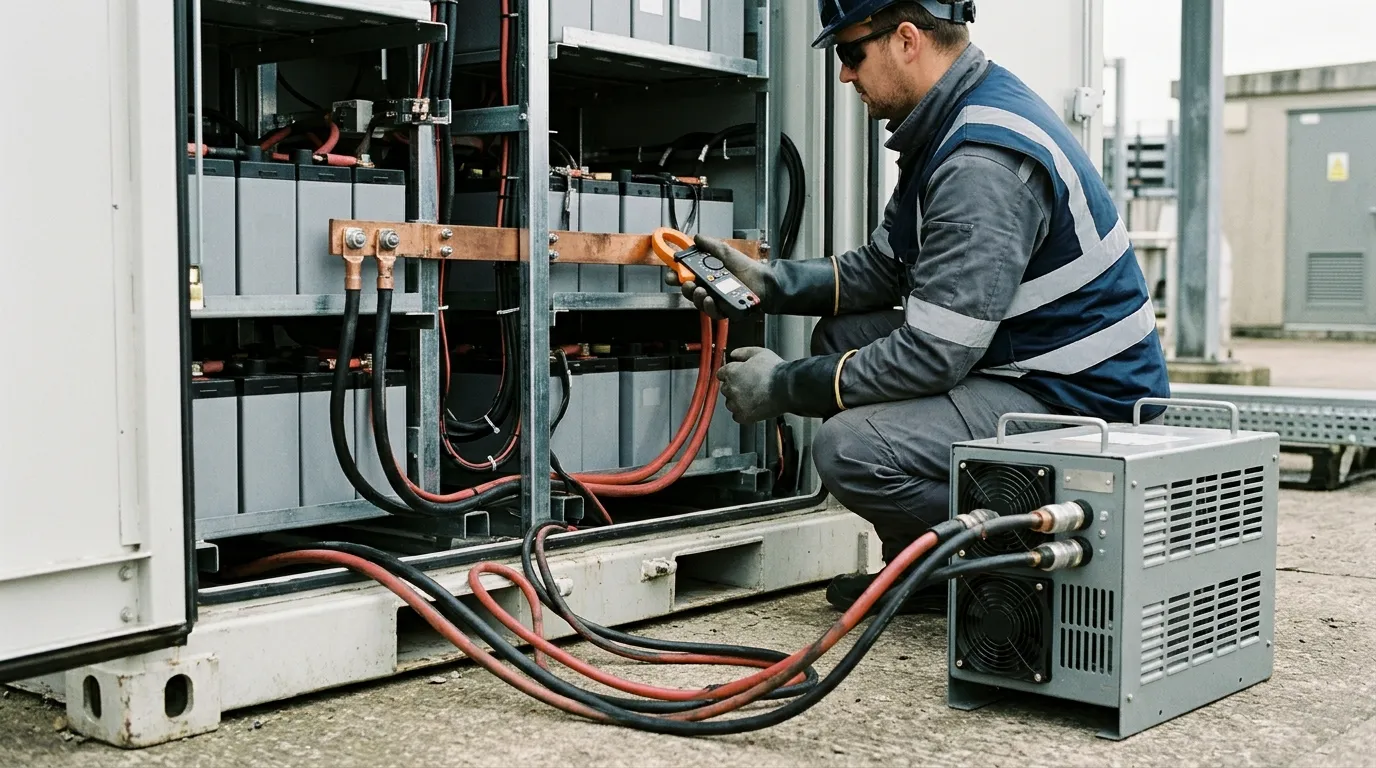
What you walk away with is a state-of-health baseline and a per-string reference, and those two numbers are what every later degradation conversation is measured against. The knowledge base entry on state of health covers how the BMS derives its own estimate; the commissioning baseline exists because the BMS estimate and a measured discharge are not the same instrument, and the argument in year six goes better when you have both from day one.
Interrogating a spec sheet in ten minutes
None of the above requires a laboratory. It requires seven questions, asked before the quote is accepted rather than after the acceptance test fails.
Question | The answer that holds up | Why it matters |
|---|---|---|
At what C-rate is the kWh figure quoted? | A rate plus a duration, e.g. "0.5C, 2 h at the POC" | A kWh with no rate is a number without units |
At what DoD is the cycle count quoted? | The DoD and the temperature of the test | 8,000 cycles at 60% DoD is not 8,000 at 90% |
Is the energy AC or DC, and at which terminals? | Stated explicitly, with conversion and auxiliary losses included | At the 85–87% round-trip efficiencies quoted here, a DC nameplate figure overstates what reaches the AC side by roughly 15–18% |
What is the retention floor at year ten, and measured how? | A schedule plus a named test method | A single end-of-term floor cannot catch early fade |
What is the throughput cap, and what happens past it? | MWh over the term, with the consequence written down | Converts cycles into your own duty cycle |
Above what temperature does the system derate, and by how much? | A threshold and a curve, not a single maximum | Derating changes the achievable C-rate in July |
Does the DoD window hold at the maximum C-rate? | Yes, or the derating that applies at that rate | Many sheets pair the best DoD with the slowest rate |
The seventh question is the one that separates a specification from a brochure. A 90% DoD window quoted alongside a 0.5C rating and a cycle count measured at 0.25C describes three different machines. A supplier who can answer it in one sentence, with the test conditions attached, has told you something about their engineering process as well as their product.
How the pair reads on a current product line
Run the arithmetic against a real container and the abstraction collapses into numbers you can check. In the current Hua Power line, the HC-UPSB5010L is a 5,015.96 kWh container rated at 0.5C or 0.25C with a 90% depth-of-discharge window and a round-trip efficiency of 87% or better; the HC-UPSB4180L is 4,179.96 kWh at 0.5C with the same 90% DoD and the same efficiency floor. The commercial cabinets in the same line carry 0.5C, 8,000 cycles or more to 80% state of health, and 85% round-trip efficiency, with a −20 °C to 50 °C operating window that derates above 45 °C.
Read the 5,015.96 kWh unit through the pair and it says: 4,514 kWh usable at 90% DoD, about 2.5 MW at 0.5C, and therefore 1.8 hours of discharge at rated power — of which roughly 3,900 kWh reaches the AC terminals of a matched PCS across a full cycle at the 87% round-trip efficiency quoted for the container (it ships as a battery block, so that figure already assumes a PCS on the AC side), or about 1.6 hours if that energy is delivered at the 0.5C rate. Rerate the same block to 0.25C and nothing about the nameplate changes, but the machine becomes a 3.6-hour asset. That is the sentence that belongs in a proposal, and it is the one a two-line datasheet rarely says.
If you want the pair evaluated against a specific duty profile — the actual charge and discharge rates your site will run, at your ambient, against your required year-ten energy — that is a sizing conversation with the engineering team rather than a catalogue lookup.
What to read next
Both halves of the pair are defined in the knowledge base, and the buying decision behind the rate itself — which C-rate to specify, and what it costs in cooling and cycle life — has its own guide. When the question moves from what the pair means to how long the asset lasts under it, the LiFePO4 battery lifespan guide carries the arithmetic through calendar aging and the retention schedule. The battery energy storage basics hub collects the rest of this cluster.