
Battery state of health (SoH) is the percentage of a battery's rated capacity that it can still deliver after use and aging — 100% when new, falling with every cycle and every calendar year, and estimated by the battery management system rather than measured directly. A 100 Ah cell that now holds 88 Ah has a state of health of 88%. Every commercial decision about a battery hangs on this number — warranty claims, dispatch revenue, replacement timing, residual value.
What Is Battery State of Health (SoH)?
State of health compares the battery's current capability with its beginning-of-life (BOL) rating:
SoH (%) = (current maximum deliverable capacity ÷ rated capacity) × 100
"Rated capacity" is the nameplate figure — the ampere-hours the battery was specified to deliver when new. "Current maximum deliverable capacity" is what a controlled discharge test measures today. The two are the same on day one; after that they diverge, and SoH records the divergence. A battery that retains 92% of rated capacity has a state of health of 92% — capacity retention is the same concept seen from the other side.
Two qualifications keep this definition honest. First, SoH is not a physical quantity like voltage or temperature; it is a figure of merit — there is no universal definition, and the parameters a BMS derives it from (capacity, internal resistance, cycle count, age, temperature history) and their weights are chosen by the system designer. Second, capacity is not the whole story: power fade driven by rising internal resistance can shorten runtime under high load even when capacity looks healthy. In practice, capacity-based SoH is the headline figure, and it is the one warranties are written against.
SoH vs SoC: What's the Difference?
State of charge (SoC) and state of health (SoH) are the two numbers a battery management system (BMS) is asked to report, and they answer different questions:
State of charge (SoC) | State of health (SoH) | |
|---|---|---|
Question it answers | How full is the battery right now? | How much of its original capacity is left, for good? |
Time scale | Changes every minute | Changes over months and years |
Analogy | Fuel gauge | Odometer |
Direction | Goes up and down | Only goes down |
The two are linked in a way that catches operators out. SoC is usually estimated by counting charge in and out — coulomb counting — against a capacity baseline, and that baseline shrinks as the battery ages. If the BMS still assumes rated capacity while real capacity has faded to 90%, every SoC reading is quietly wrong. That is why an accurate SoH estimate is an input to the fuel gauge, not a display value: when a BMS says it is recalibrating capacity, it is updating its SoH assumption.
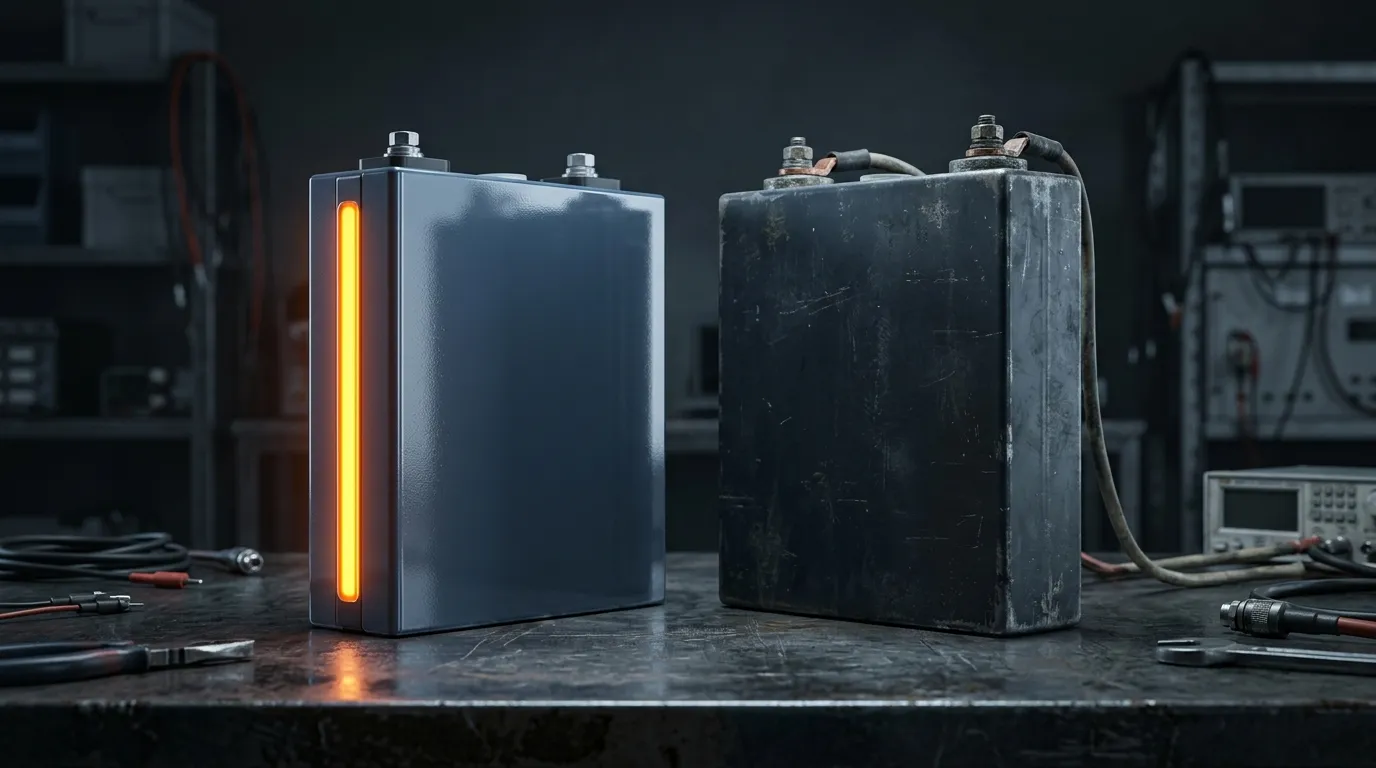
Image: state of charge is a level that changes daily; state of health is the aging condition underneath it — two different questions answered by the same BMS.
What Causes State of Health to Decline?
SoH declines because the cell's chemistry ages in two modes that add up. Cycle aging is the wear accumulated with every charge and discharge — growth of the solid-electrolyte interphase, lithium plating under cold or fast charging, mechanical stress on electrode particles. Calendar aging proceeds even when the battery sits idle: a fully charged cell parked in a warm room loses capacity to the same side reactions, which is why a rarely cycled backup battery can still reach end of life on the calendar. Four stress factors accelerate both modes, and all four are largely under the operator's control:
Stress factor | Why it accelerates aging | Practical control |
|---|---|---|
Temperature | Heat speeds up every side reaction; cold + fast charge risks lithium plating | Active thermal management keeps cells in their rated band |
Time at high SoC | Dwelling near full charge is chemically aggressive even without cycling | Cap charge voltage; avoid parking at 100% |
Depth of discharge | Deeper cycles move more lithium and strain the structure | Respect the depth of discharge (DoD) window the warranty assumes |
C-rate | Higher currents add heat and mechanical stress per cycle | Match the C-rate to the duty |
The blunt lesson of aging research: elevated temperature and long dwell at high charge are often more stressful than normal cycling. Battery University's BU-808 guide notes that high temperature "hastens permanent capacity loss" and that partial charge/discharge windows substantially extend service life. "Permanent" is the word to hold on to: the loss behind a falling SoH is chemical and irreversible — recalibration makes the reported number accurate again, but never recovers capacity.
How Is Battery State of Health Measured and Estimated?
SoH cannot be read off a sensor, so the industry uses two complementary paths: an offline reference measurement and online estimation.
The reference: a controlled capacity test. The battery is fully charged, then discharged at a defined constant current (typically 0.5C or 1C) to the cutoff voltage at controlled temperature, and the delivered ampere-hours are compared with the rated capacity. The result is ground-truth SoH — but the battery must be offline for hours, so capacity tests run only at commissioning, at warranty milestones, and when a dispute needs an arbitrated number.
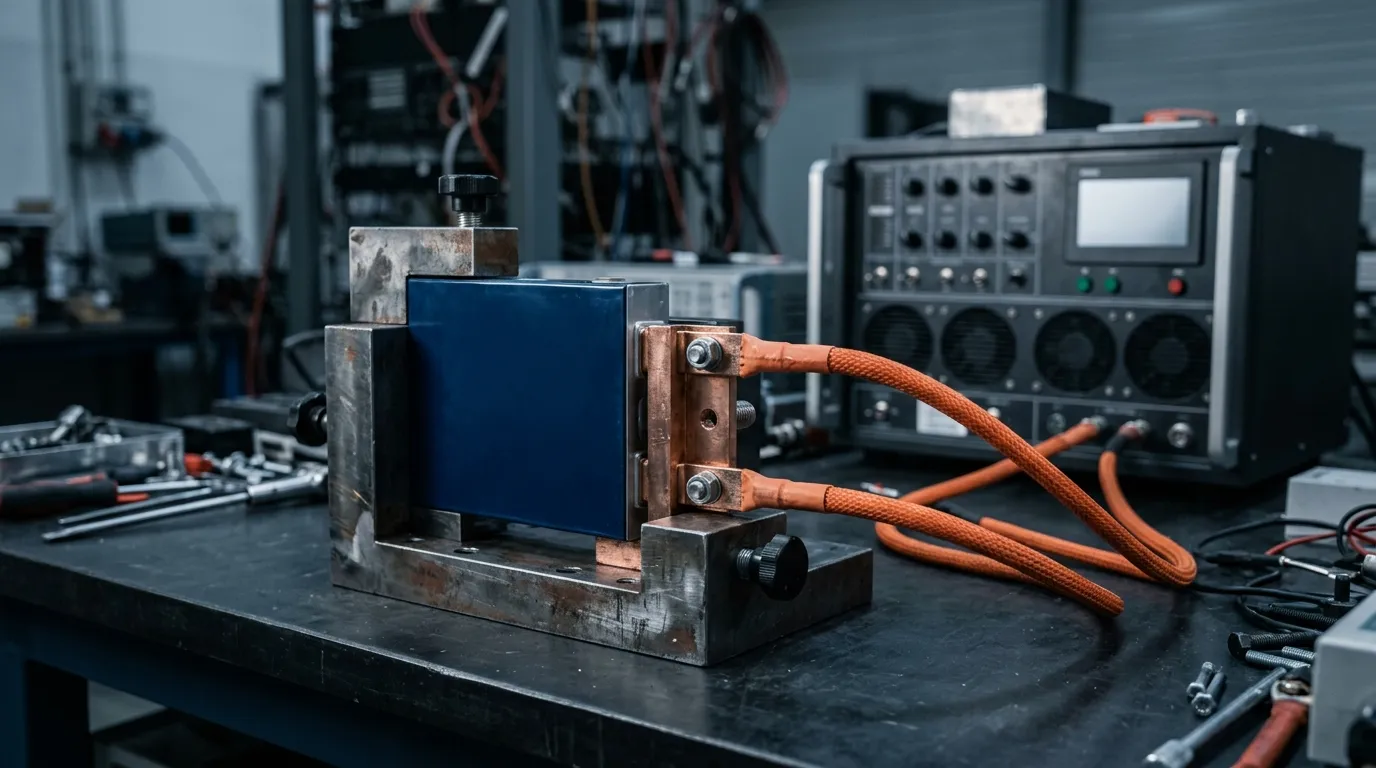
Image: the controlled capacity test is the ground-truth measurement behind every SoH number — accurate, but it takes the battery offline for hours.
The everyday estimate: the BMS's online SoH. Between capacity tests, the BMS infers state of health from signals it already samples. A 2025 review in MDPI's World Electric Vehicle Journal organizes the field into three families:
- Direct/indicator methods track the two dominant health indicators — capacity fade and internal-resistance increase. Resistance is probed online from current/voltage pulses (DCIR) or, in the lab, with impedance spectroscopy (EIS).
- Model-based methods fit an equivalent-circuit or electrochemical model and estimate its aging parameters with filters — physically grounded, but needing careful parameterization across aging states.
- Data-driven methods use machine-learning models trained on aging data, which excel at fusing voltage, current, and temperature signals but depend on the quality of their training data.
The review's finding matches field experience: capacity, internal-resistance, and temperature-related indicators have the largest influence on SoH estimation accuracy.
Every method produces an estimate with error. Sensor offset makes coulomb counting drift; resistance readings shift with temperature, so a winter reading and a summer reading of the same cell differ; and in a series string the pack is limited by its weakest cell, so a rack-average SoH can look fine while one module drags the string down. Because SoH feeds the SoC baseline, a stale estimate makes every downstream number stale — the quality of that estimation logic, not just the cells, is what separates a trustworthy battery from a cheap one. The BMS explainer on this site covers how estimation firmware handles exactly these error sources.
What SoH Percentage Is "Healthy"? Thresholds by Application
There is no universal answer. The same battery at 75% SoH is at the end of its road in one application and fully serviceable in another — thresholds are set by each application's economics and safety case, not by the chemistry:
Application | Typical threshold | Why |
|---|---|---|
EV first life | ~70–80% SoH | Range loss and power fade end the pack's vehicle service in this band |
New stationary storage (warranted) | 80% capacity retention at the warranty limit (some vendors 70%) | A contract threshold — see our cycle life explainer on why 80% and 70% are not comparable numbers |
Second-life storage (repurposed EV packs) | Below 80% at entry; operated to ~60–70%+ by duty | Cheaper energy, but the system must be engineered for its degradation state |
Critical / UPS-class | 90%+ | A voltage sag at the wrong moment costs more than replacing the battery |
Two authorities bracket this table. Wikipedia's state of health article notes that a given application may accept a battery at 50% SoH while a more critical one demands 90% or better — the retirement threshold is set by the application, not the chemistry. And the U.S. Department of Energy's Battery Recycling and Second-Life Applications program documents second-life storage operating below 80% SoH, with SoH the critical input for screening, reassembly, and safe operation of repurposed packs.
For a quick check of your own numbers: 90%+ is a young or lightly cycled battery; 80–90% is normal mid-life for daily cycling; ~80% is where EV first life and most stationary warranties end; below that is second-life or retirement territory, by application. Percentages never tell the whole story on their own — read them against the test conditions and the definition behind them.
Why Battery State of Health Matters in Energy Storage
For a storage asset, SoH is where engineering meets the contract — four ways:
- Warranty exposure. Storage warranties are capacity-retention promises: "X cycles or Y years, whichever comes first, to 80% retention." SoH is the measured evidence, verified by capacity tests at milestones.
- Revenue per year. A system earning on throughput delivers less usable energy each season as capacity fades — SoH, with round-trip efficiency, sets how much stored energy becomes revenue.
- Degradation-aware operation. An energy management system (EMS) that knows current SoH can trade a little throughput today for a longer life — tightening SoC windows and holding high-rate work for the hours that pay.
- Residual value and second life. At resale, refinancing, or repurposing, SoH is the number both sides negotiate from; a documented SoH history turns a retired pack into a priced second-life asset instead of a recycling fee.
The buyer's takeaway: a capacity-retention curve and a definition of how SoH is measured are specifications, not footnotes. Two quotes with the same kilowatt-hours can hide very different warranted capacity at year ten — ask how SoH is estimated, when it is verified by full capacity test, and which threshold the warranty actually guarantees.
Battery State of Health: Common Questions
Is 92% battery health good? For a battery in its first years, yes — roughly 8% capacity loss is normal early-life fade for lithium chemistries. Whether 92% is acceptable depends on the application: near end of life for a critical UPS, perfectly healthy for a lightly cycled storage battery.
Can battery state of health be restored? No — the loss behind a falling SoH is chemical and permanent. What can be restored is the accuracy of the reported number: recalibrating the BMS capacity baseline makes the display honest again. An SoH "recovery" after recalibration is a measurement correction, not a repair.
Does SoH affect SoC accuracy? Directly. SoC is counted against a capacity baseline; if the baseline is nameplate capacity instead of the true faded capacity, every SoC percentage is off by the same margin as the capacity loss.
What is the difference between SoH and capacity fade? The same phenomenon in two units. Capacity fade is the loss (a 100 Ah cell faded by 8 Ah); SoH is what remains (92%).
How Hua Power Monitors Battery Health
Hua Power treats state of health as a monitored, reported, and warrantied quantity — not a number discovered at the end of a battery's life.
First, the estimation logic is ours. Hua Power develops the hardware and firmware of its BMS in-house: per-cell-group voltage, current, and temperature sensing on every channel, with no ganged sensing. The BMS infers state of health over the pack's life from capacity fade, resistance growth, and cycle count, and its coulomb-counting SoC estimation is tuned for LiFePO4 (LFP)'s flat voltage curve and re-anchored where the curve finally moves — keeping the SoC/SoH coupling error above in check.
Second, the cells start well matched. Hua Power builds on one standardized 3.2 V / 314 Ah large-format LFP cell, graded and matched at the line, so the BMS begins from cells that age together.
Third, the operating environment is controlled. Liquid-cooled energy storage cabinets — the HC261P and HC522P lines across the C&I range — hold cells near rated temperature so cycling heat does not feed back into faster aging.
Fourth, the numbers are tested against the contract. Cycle-life ratings are published with their conditions (6,000 cycles at 80% DoD, 25 °C, 0.5C), warranties are capacity-retention promises bounded by cycles or years, whichever comes first, and the SoH milestones they reference are verified by capacity tests at defined points.

Image: in Hua Power's liquid-cooled cabinets, per-cell-group sensing and in-house BMS firmware turn state of health from a brochure claim into a continuously reported number.
If you are comparing storage quotes and want to see how a vendor defines, estimates, and warrants state of health — including the capacity-retention test data behind a system — contact us.