
A knee point in battery aging is the point on the capacity fade curve where the rate of degradation abruptly accelerates, marking the transition from gradual, nearly linear capacity loss to rapid, nonlinear aging. It is the moment a battery's health curve visibly bends downward — the "knee" of the curve. This article explains what the knee point is, what causes it, how to detect it, and why it matters for anyone buying, operating, or warranting lithium-ion energy storage.
One clarification up front, because the term is overloaded: "knee point" is also used in electrical testing (the knee point voltage of a current transformer) and in mathematics. This article covers only the battery aging sense — the inflection on a lithium-ion cell's capacity fade trajectory. In battery research it is also called rollover failure, nonlinear aging, or sudden death.
What Is a Knee Point in Battery Aging?
A healthy lithium-ion battery does not lose capacity at a constant rate over its life. For most of its life the capacity fade curve is close to linear: the cell loses a small, predictable percentage of capacity per cycle, and operators can project the trend months ahead. Then, at some point, the curve changes shape — capacity loss per cycle climbs sharply, and the remaining lifetime shrinks much faster than the earlier trend suggested. That bend is the knee point.
The position of the knee varies by cell chemistry, design, and operating conditions. For some cells it appears early and dramatically; for others it may be late and gentle, or barely visible within a normal service life. This variance is exactly why the knee matters: two cells can look identical early in life and diverge sharply at the knee — and only one will still be a reliable asset when the contract calls for it.
Where the Knee Sits on the Capacity-Fade Curve
The clearest way to see a knee point is to plot capacity retention (or state of health) against cycles or energy throughput. The curve has three visually distinct regions: a gently sloping linear segment, a bend, and a steeper trailing segment. The bend is the knee.
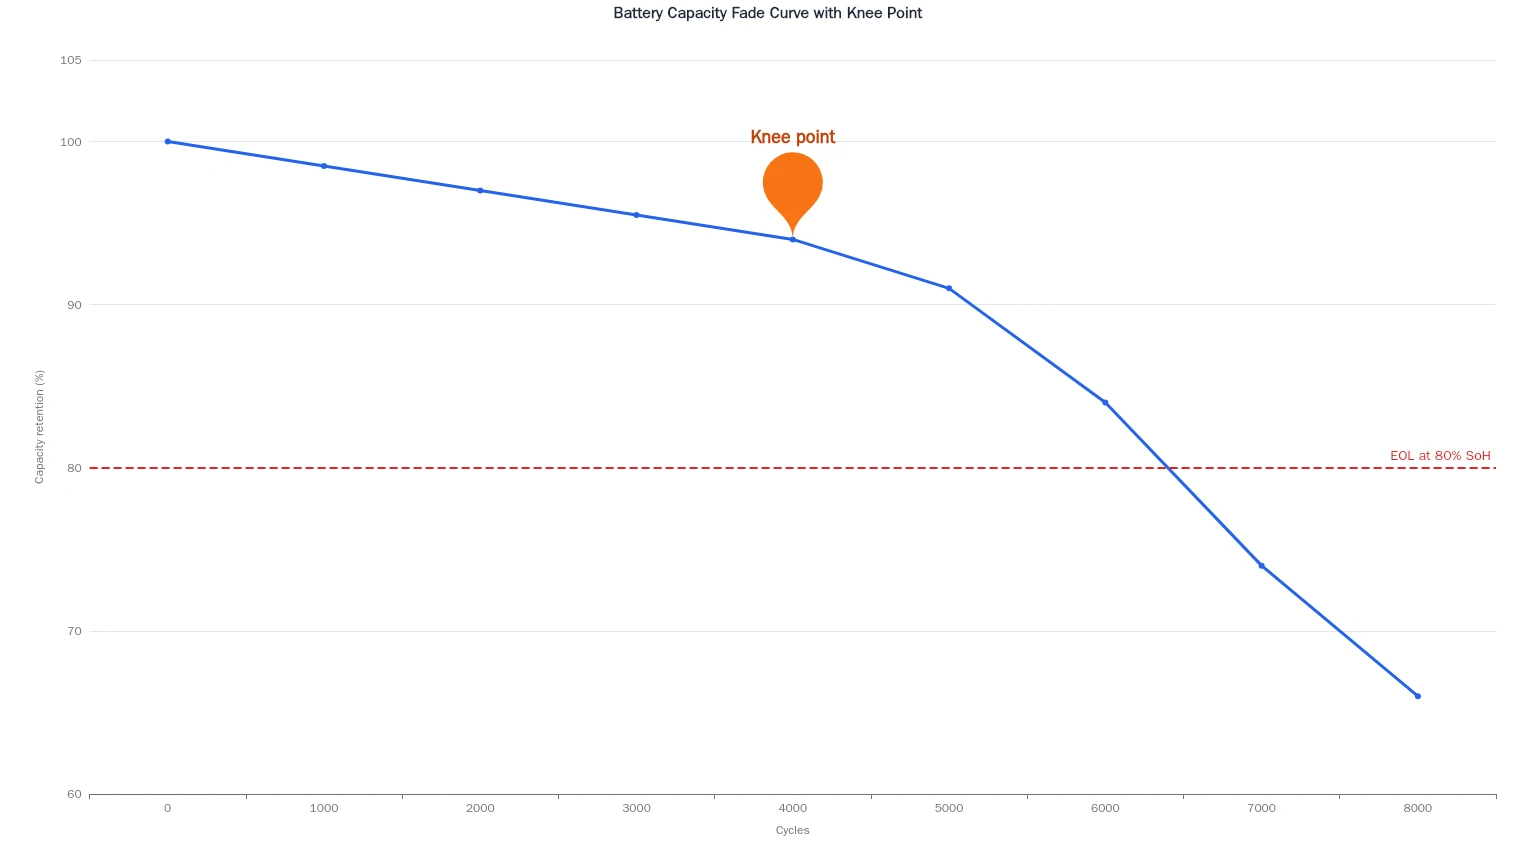
Image: a typical capacity fade trajectory — gradual linear aging before the knee, rapid nonlinear aging after it.
The industry convention defines end of life (EOL) at roughly 80% of original rated capacity — the moment the battery has lost a fifth of its usable energy. The knee point usually appears somewhere before that line, and the distance between the knee and the 80% mark is a rough measure of how much warning the system gives before end of life arrives. The steeper the post-knee slope, the shorter that warning window. A cell rated 6,000 cycles can reach the knee at very different points depending on how it is cycled — one reason cycle-life numbers without test conditions are hard to compare.
Why the Knee Point Matters
The knee point matters because it is the difference between aging you can plan around and aging that surprises you. Before the knee, capacity fade is predictable enough to forecast remaining life with reasonable confidence. After the knee, the degradation rate changes, and a system sized for the early trend will underdeliver.
- Remaining-life forecasts: prediction models built on the linear region lose accuracy once the knee arrives. Knowing the knee's position improves estimates of remaining useful life.
- Warranty exposure: warranties are written against state of health thresholds, usually 80%. A battery that hits its knee early and plunges through the 80% line is a warranty event; one that never reaches a visible knee inside the term is not.
- Replacement timing: in multi-cabinet systems, one unit reaching its knee while its siblings are healthy changes the economics of the whole site — replace one, or rebalance the system?
The research community has shown the knee is detectable before it visibly appears. In a landmark 2019 study, Severson et al. predicted battery cycle life from the first five charge-discharge cycles alone — data-driven prediction of battery cycle life before capacity degradation. For a storage buyer, that is the difference between catching a problem at commissioning and discovering it at year five.
What Causes the Knee?
The knee is not a single mechanism — it is the point where one or more degradation processes cross a threshold and begin to dominate. The most comprehensive review of the subject, “Knees” in Lithium-Ion Battery Aging Trajectories (Attia et al., 2022), catalogues the leading candidates:
- Lithium plating: lithium metal deposits on the anode surface instead of intercalating into the graphite. Plating accelerates at low temperature and high charge rate and consumes cyclable lithium — a classic knee driver in fast-charging applications.
- SEI growth and breakdown: the solid-electrolyte interphase on the anode grows and periodically cracks, exposing fresh electrode surface that consumes more lithium. Growth is slow until a threshold where it accelerates.
- Electrode particle cracking: mechanical stress from cycling fractures active material, reducing capacity and raising impedance — the damage compounds because cracked particles stress their neighbors.
- Electrolyte decomposition and dry-out: the electrolyte degrades and is consumed, starving the cell of ionic transport.
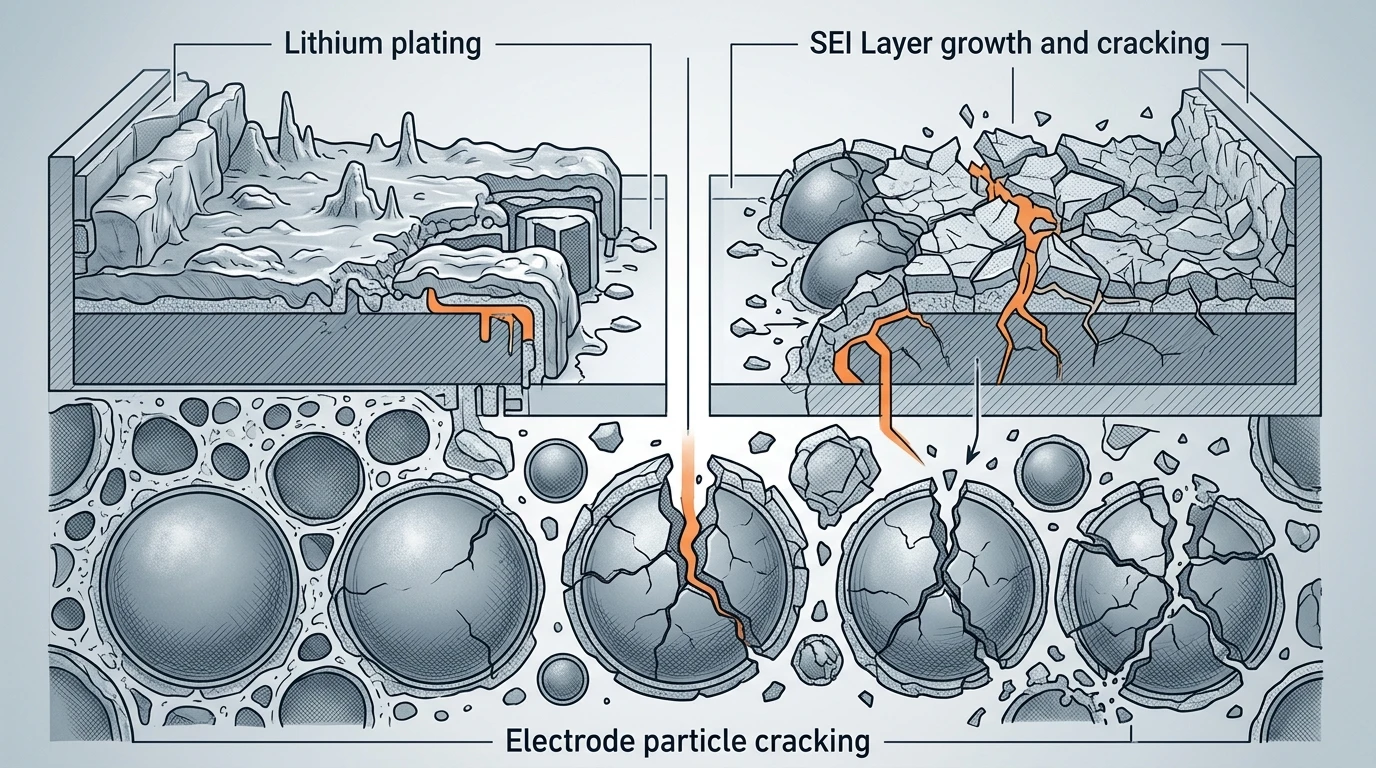
Image: the dominant degradation mechanisms that drive the knee — lithium plating, SEI growth, and particle cracking.
Three operating levers move the knee in a predictable direction — this is where operators have real influence:
- Depth of discharge: shallower cycles stress electrodes less. The relationship between depth of discharge and aging is steeply nonlinear, and DoD is one of the biggest levers on when the knee arrives.
- Temperature: heat accelerates most degradation chemistries. A cell cycled hot reaches its knee earlier, which is why thermal management directly buys lifetime.
- Charge/discharge rate: faster C-rates increase heat and mechanical stress per cycle, pulling the knee forward.
The practical implication: the knee's position is not purely a cell property — it is a property of the cell under operating conditions. Two identical cells, one cycled gently and one hammered, will show knees at very different points.
Knee Point vs Related Terms
The knee point sits in a cluster of related concepts that are easy to confuse. The distinctions matter because they change what action you take:
Term | What it means | How it differs from the knee |
|---|---|---|
Knee point | The inflection where capacity fade accelerates | The event itself — a change in the rate of aging |
Linear aging | Slow, roughly constant capacity loss | The regime before the knee; predictable and steady |
Rollover failure / nonlinear aging | The accelerated aging regime after the knee | The result of the knee — same phenomenon, other side |
Sudden death | A rapid, near-catastrophic capacity drop near end of life | An extreme version of post-knee aging, common in some NMC cells |
End of life (EOL) | Conventionally 80% of rated capacity remaining | A threshold you define; the knee is a curve feature, EOL is a contract line |
Two boundaries are worth stating explicitly. First, the knee is not end of life: it is the warning that end of life is approaching, and the gap between them is the actionable window. Second, the knee is a property of the aging curve, not of a single measurement — you cannot see it in one capacity check, only in a trajectory.
How to Detect the Knee Point
Because the knee is a shape in a curve, detection is a signal-processing problem. Several practical approaches exist:
- Capacity threshold tracking: the simplest method. Track capacity or state of health over time and flag when the rate of decline (the slope) increases beyond a threshold. Cheap, but it detects the knee after it has begun.
- dQ/dV analysis (differential capacity): plotting the derivative of charge with respect to voltage reveals peaks that correspond to phase transitions in the electrodes. Changes in dQ/dV peak structure are among the earliest observable signs of degradation — the method researchers use to see aging before capacity measurably drops.
- Knee-onset detection algorithms: automated routines that scan the capacity trajectory for the change point, using methods adapted from general curve analysis (for example, the Kneedle algorithm). They find the bend reliably once enough trajectory history exists.
- Data-driven early prediction: machine-learning models trained on early-life data can forecast the knee long before it appears — the Severson approach extended to knee prediction specifically. The frontier, and the most valuable for warranty and sizing decisions.
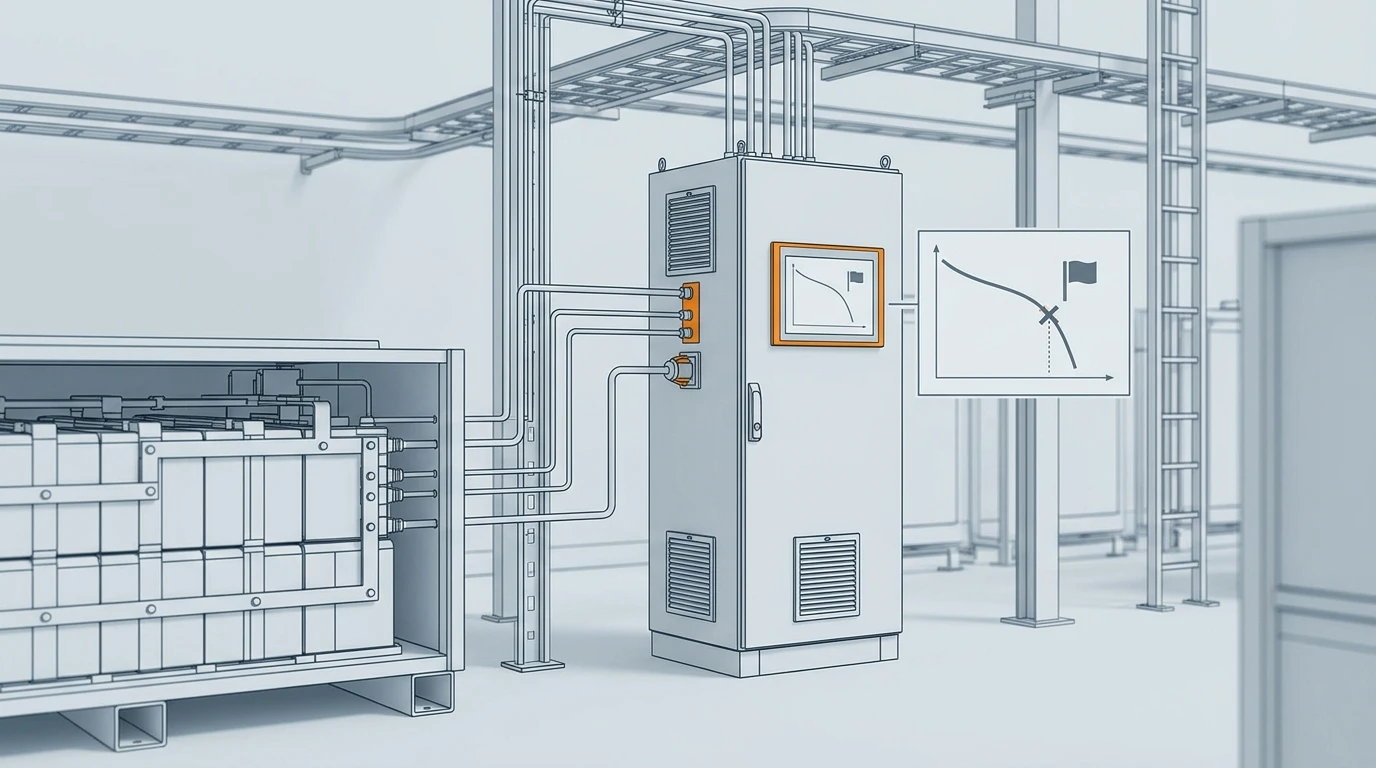
Image: how knee detection works in a deployed system — the BMS watches the capacity trajectory and alerts when it bends.
In a deployed storage system, these methods run inside the battery management system. A battery management system (BMS) already measures voltage, current, and temperature continuously and estimates state of health; adding knee detection means the BMS's SOH tracking is compared against a degradation model, and an alert is raised when the measured trajectory starts deviating toward a knee. The earlier the alert, the more options the operator has — adjust the operating profile, service the unit, or plan a replacement.
What the Knee Means for Energy Storage Operations
For commercial and industrial energy storage, the knee point is an economic event as much as an electrochemical one. A system that crosses its knee early stops delivering the throughput its sizing assumed, and the project economics — the reason the battery was bought — degrade with it.
Three operational takeaways:
- Size for the knee, not the datasheet. When comparing quotes, ask where the knee typically appears for the cell under your duty cycle, not just what the cycle-life headline says. Cells with similar cycle ratings can have very different knee behavior, and the difference shows up in year five, not year one.
- Read warranties as knee contracts. A warranty that only promises capacity at end of term says nothing about when the fade accelerates. Language that references state of health milestones throughout the term gives you a claim point if a unit knees early.
- Plan second life around the knee. The capacity remaining at end of life is not zero — a battery that has crossed its knee still holds useful energy for less demanding applications, and the knee point is the natural boundary between primary duty and second life. This is one reason LFP has become the default chemistry for stationary storage: its knees tend to be later and gentler than the sharp knees typical of NMC cells.
Grid-scale storage is increasingly central to how the electricity system is operated — the U.S. Department of Energy's energy storage program tracks exactly these assets. For a lithium-ion battery, the knee is the single most important feature of its aging curve.
How Hua Power Implements Knee-Point Detection
Hua Power builds C&I and residential energy storage systems around LFP cells, and knee-point awareness is built into the monitoring stack rather than left to the datasheet. Our battery management system tracks per-cell voltage, current, and temperature continuously and estimates state of health from the full operating history — not just from a single measurement. That SOH trajectory is compared against a degradation model, so the shape of the curve, not just the current value, triggers a warning.
When the measured trajectory begins to deviate from the expected linear region — the early signature of a knee — the system flags the unit for review, and the energy management system can adjust operating parameters such as depth of discharge limits or thermal setpoints to pull the knee back. The same data feeds the warranty conversation: capacity milestones are documented continuously, so if a unit ages faster than its design curve, there is a record of when and how.
None of this changes the electrochemistry — the knee will arrive when it arrives. What it changes is that you see it coming, in time to decide what to do about it. If you are evaluating energy storage and want to understand how knee-point detection applies to your duty cycle, talk to our engineering team — the data you need is in the curve.